
Notes & editor
This page covers everything about writing in Graphium: creating notes, finding them again, the block editor — block types, the slash menu, math, media, templates, index tables, note links — and how saving, history, and versions work. Step blocks and the provenance graph they feed have their own page: Labels & provenance.
Creating a note
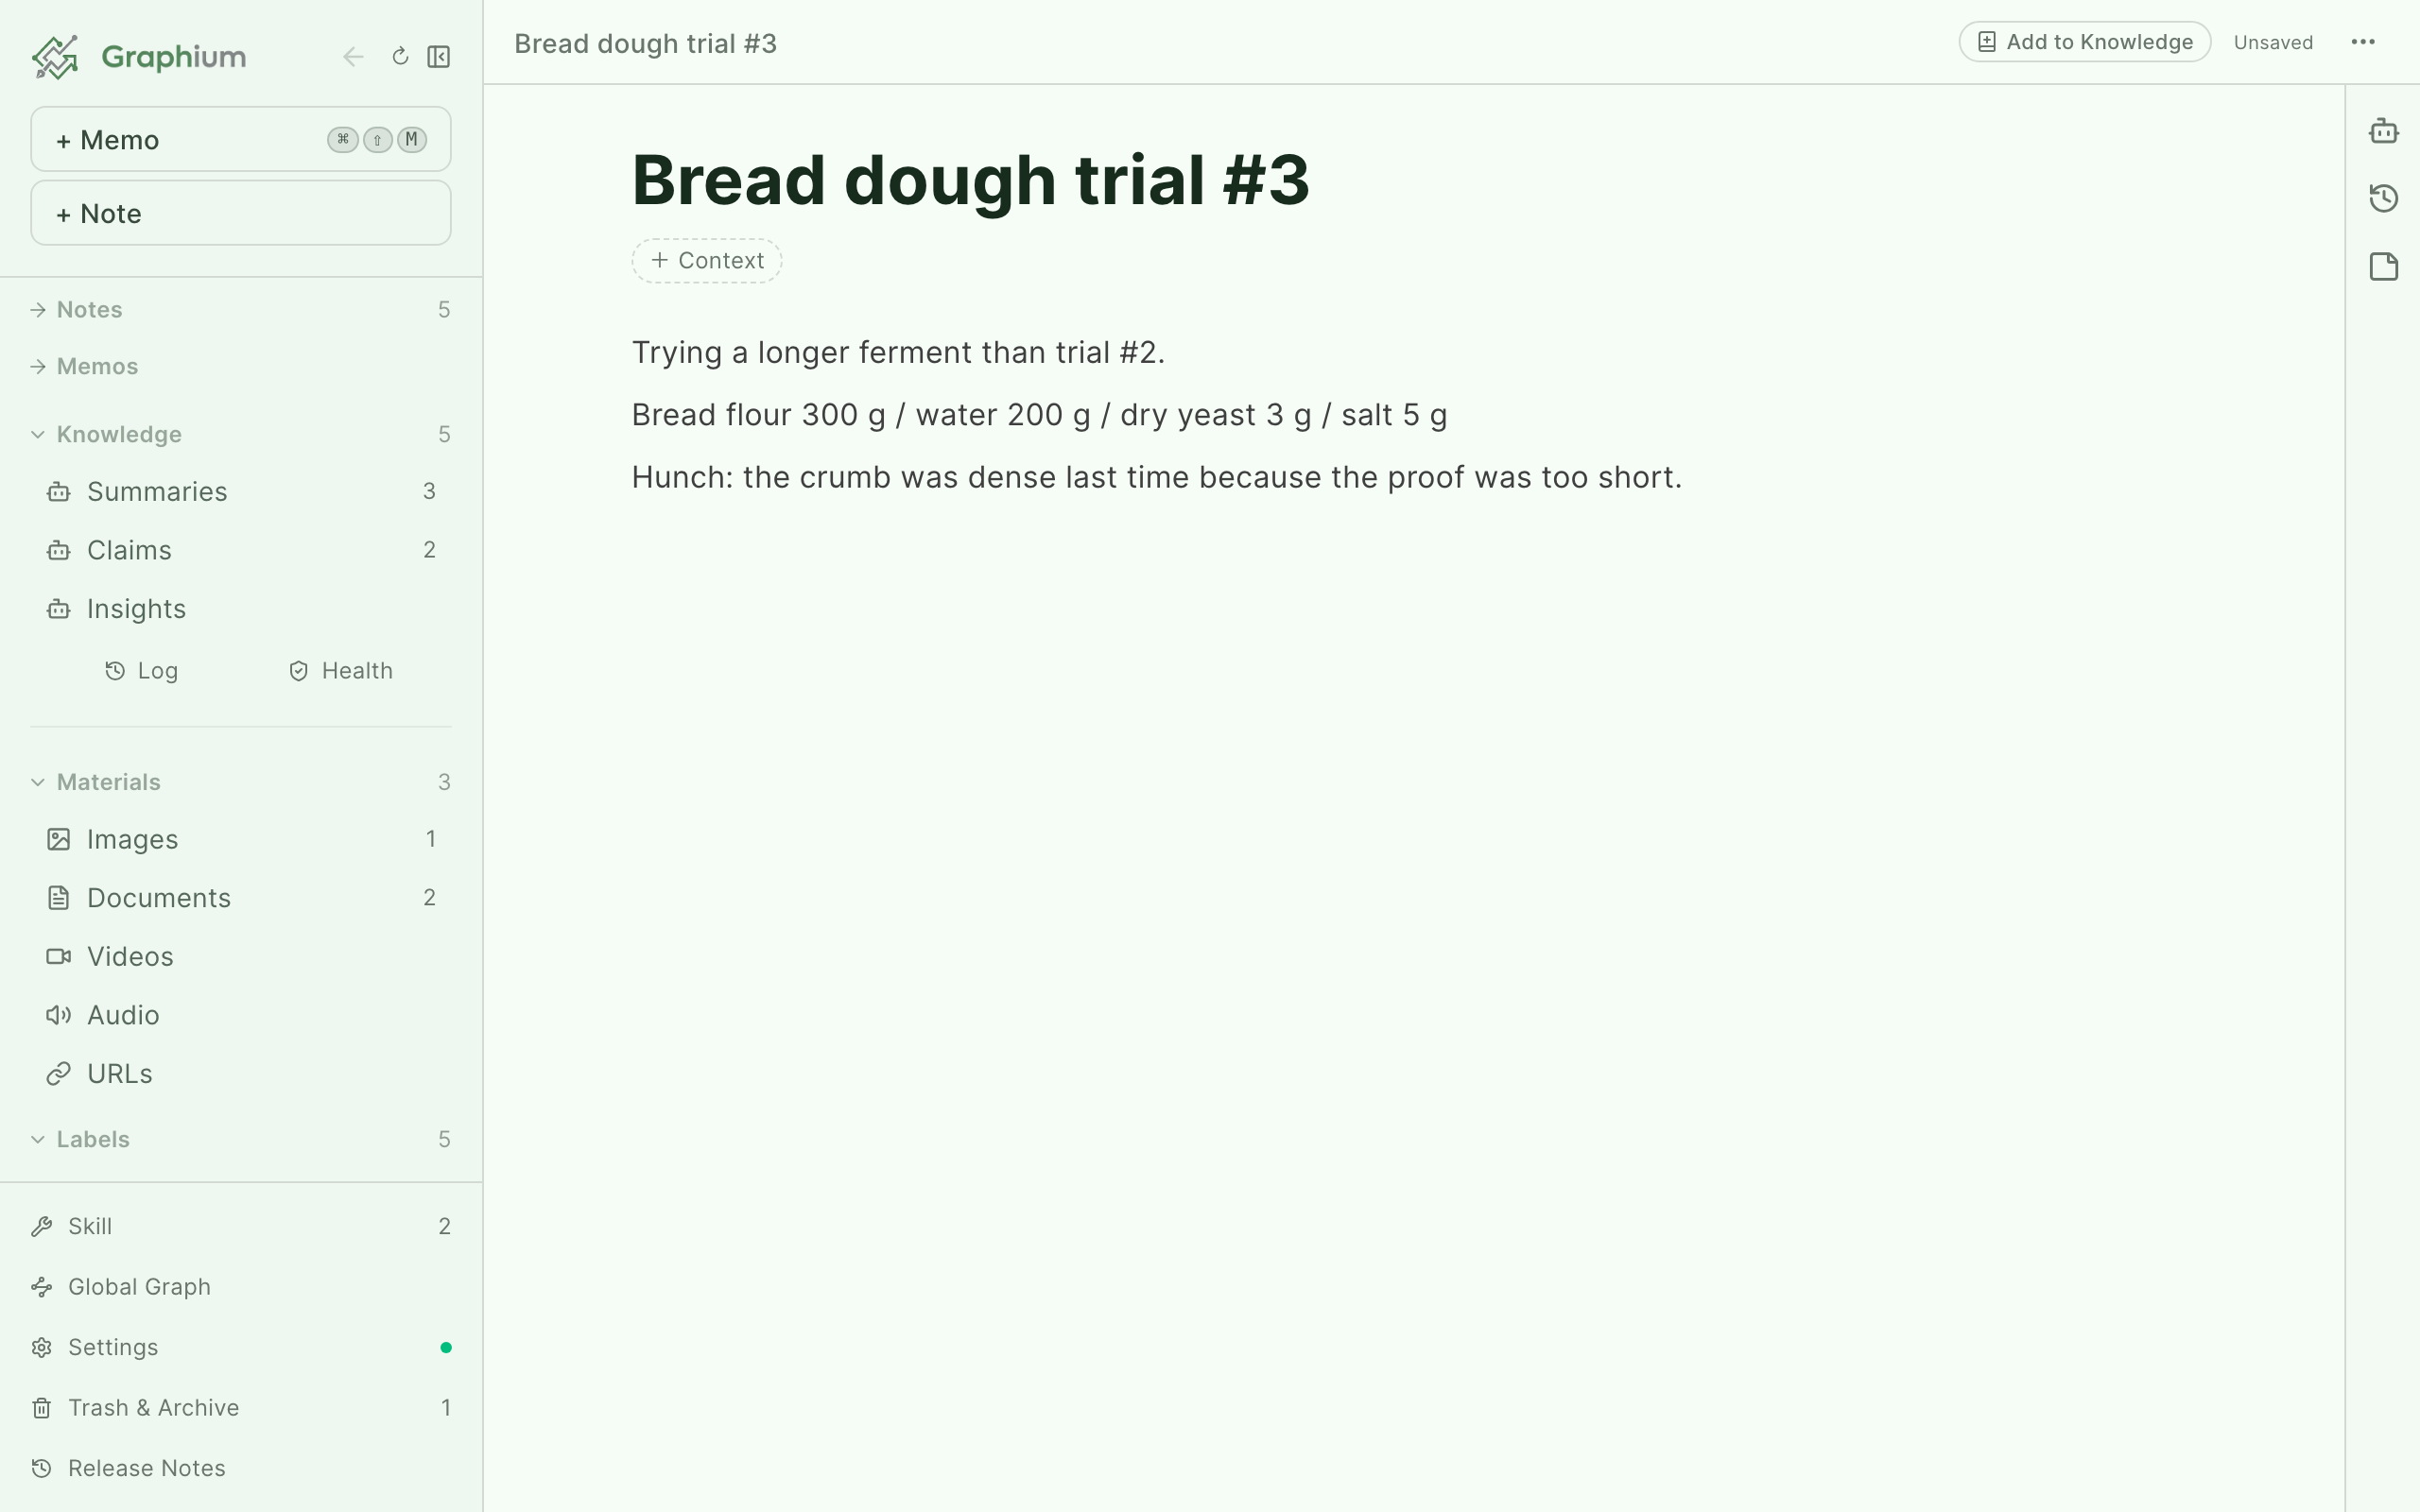
Click + Note at the top of the sidebar ("Open a new note"). A blank note opens with the cursor in the title field ("Note title"). The note file is created on first save — start typing and autosave does the rest.
No ⌘⇧N shortcut
Graphium deliberately does not bind ⌘⇧N (Ctrl+Shift+N on Windows/Linux) to "new note" — browsers reserve that combination for a new incognito window. The + Note button is the entry point. See Shortcuts for what is bound.
The notes list
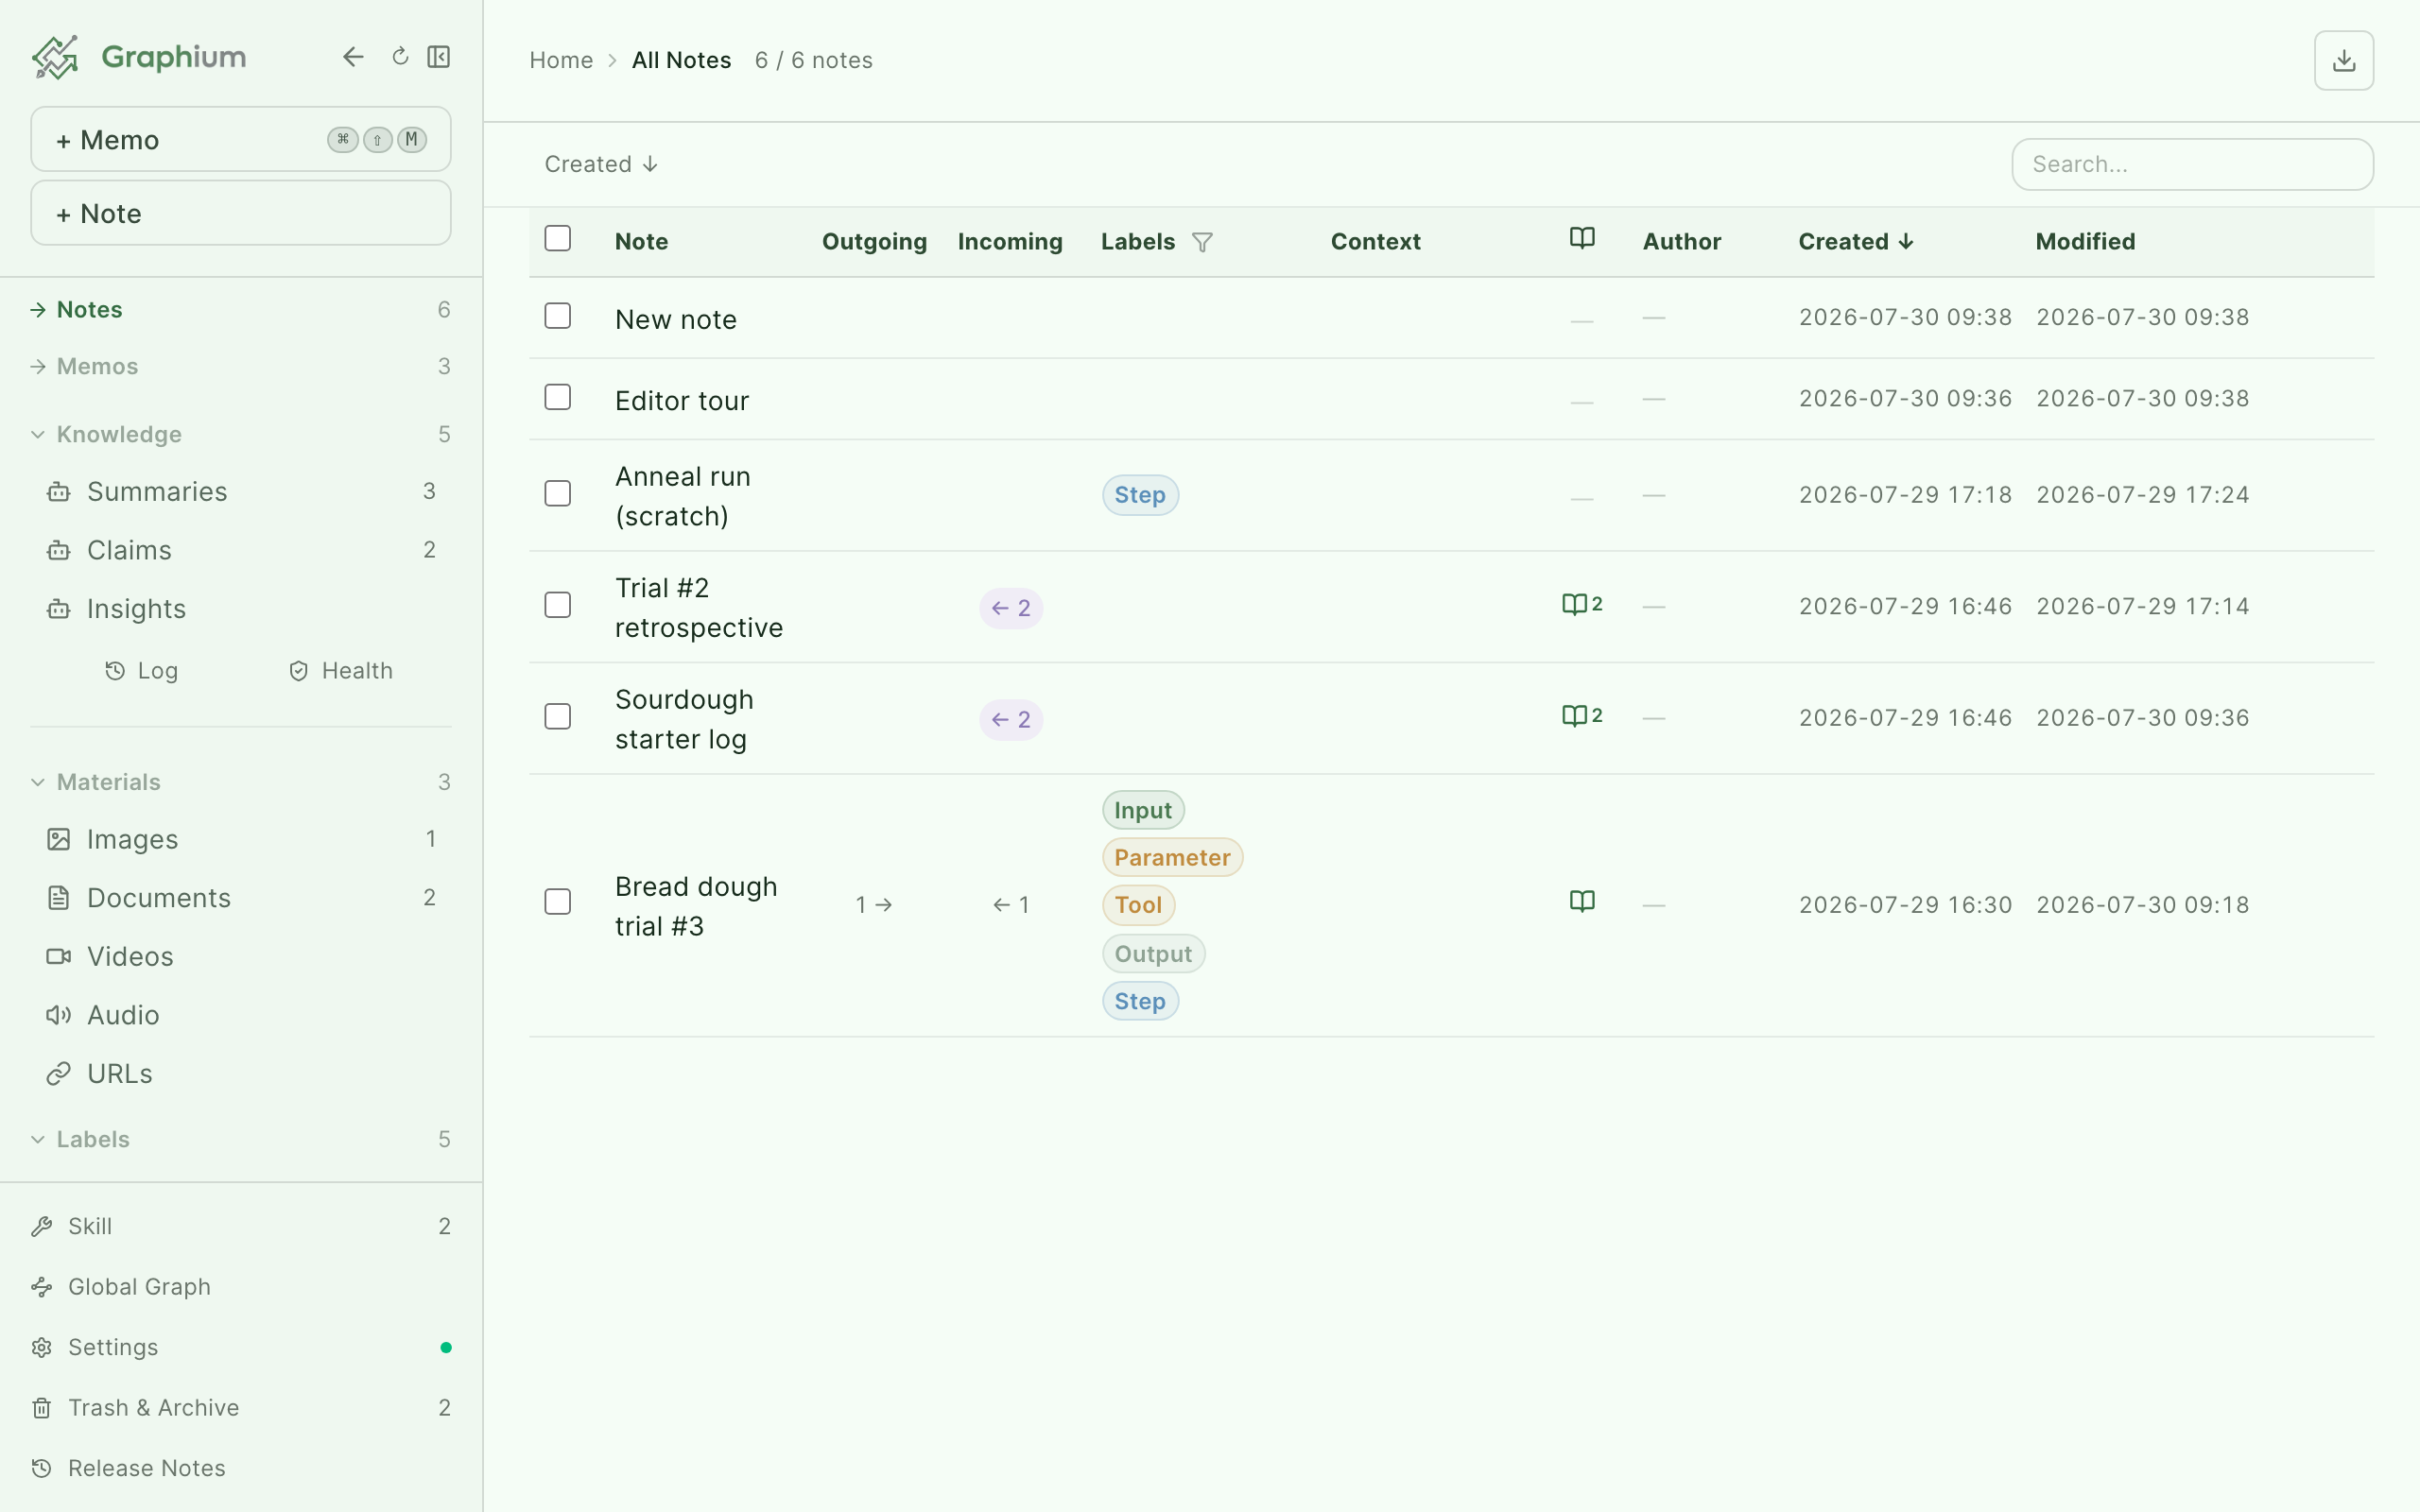
All Notes shows every note as a table with a search box ("Search notes...") and a live count ("12 / 40 notes"). The box matches titles, text read from images, and the note body itself Added in v0.39.0 (2026-08-17) — a body-only match is marked with an in body badge, and hovering it shows the passage that matched. The sidebar also keeps a Recent Notes section for quick jumps back to what you last opened, with Show all leading to the full list.
| Control | What it does |
|---|---|
| Sort by modified / Sort by created / Sort by title / Sort by outgoing links | Reorders the list. The default is by creation date. |
| Filter by label | Show only notes that contain a given provenance label. |
| Filter by author | Filter by who wrote the note — and which LLM assisted. |
| Filter by context | Filter by context tags. |
| Clear filter | Back to everything. |
Selecting rows lets you act in bulk: move notes to trash, archive them, or add a context tag to all of them at once. Archived and trashed notes live in the Trash & Archive view — archiving shelves a note while links and citations to it keep resolving.
Editor basics
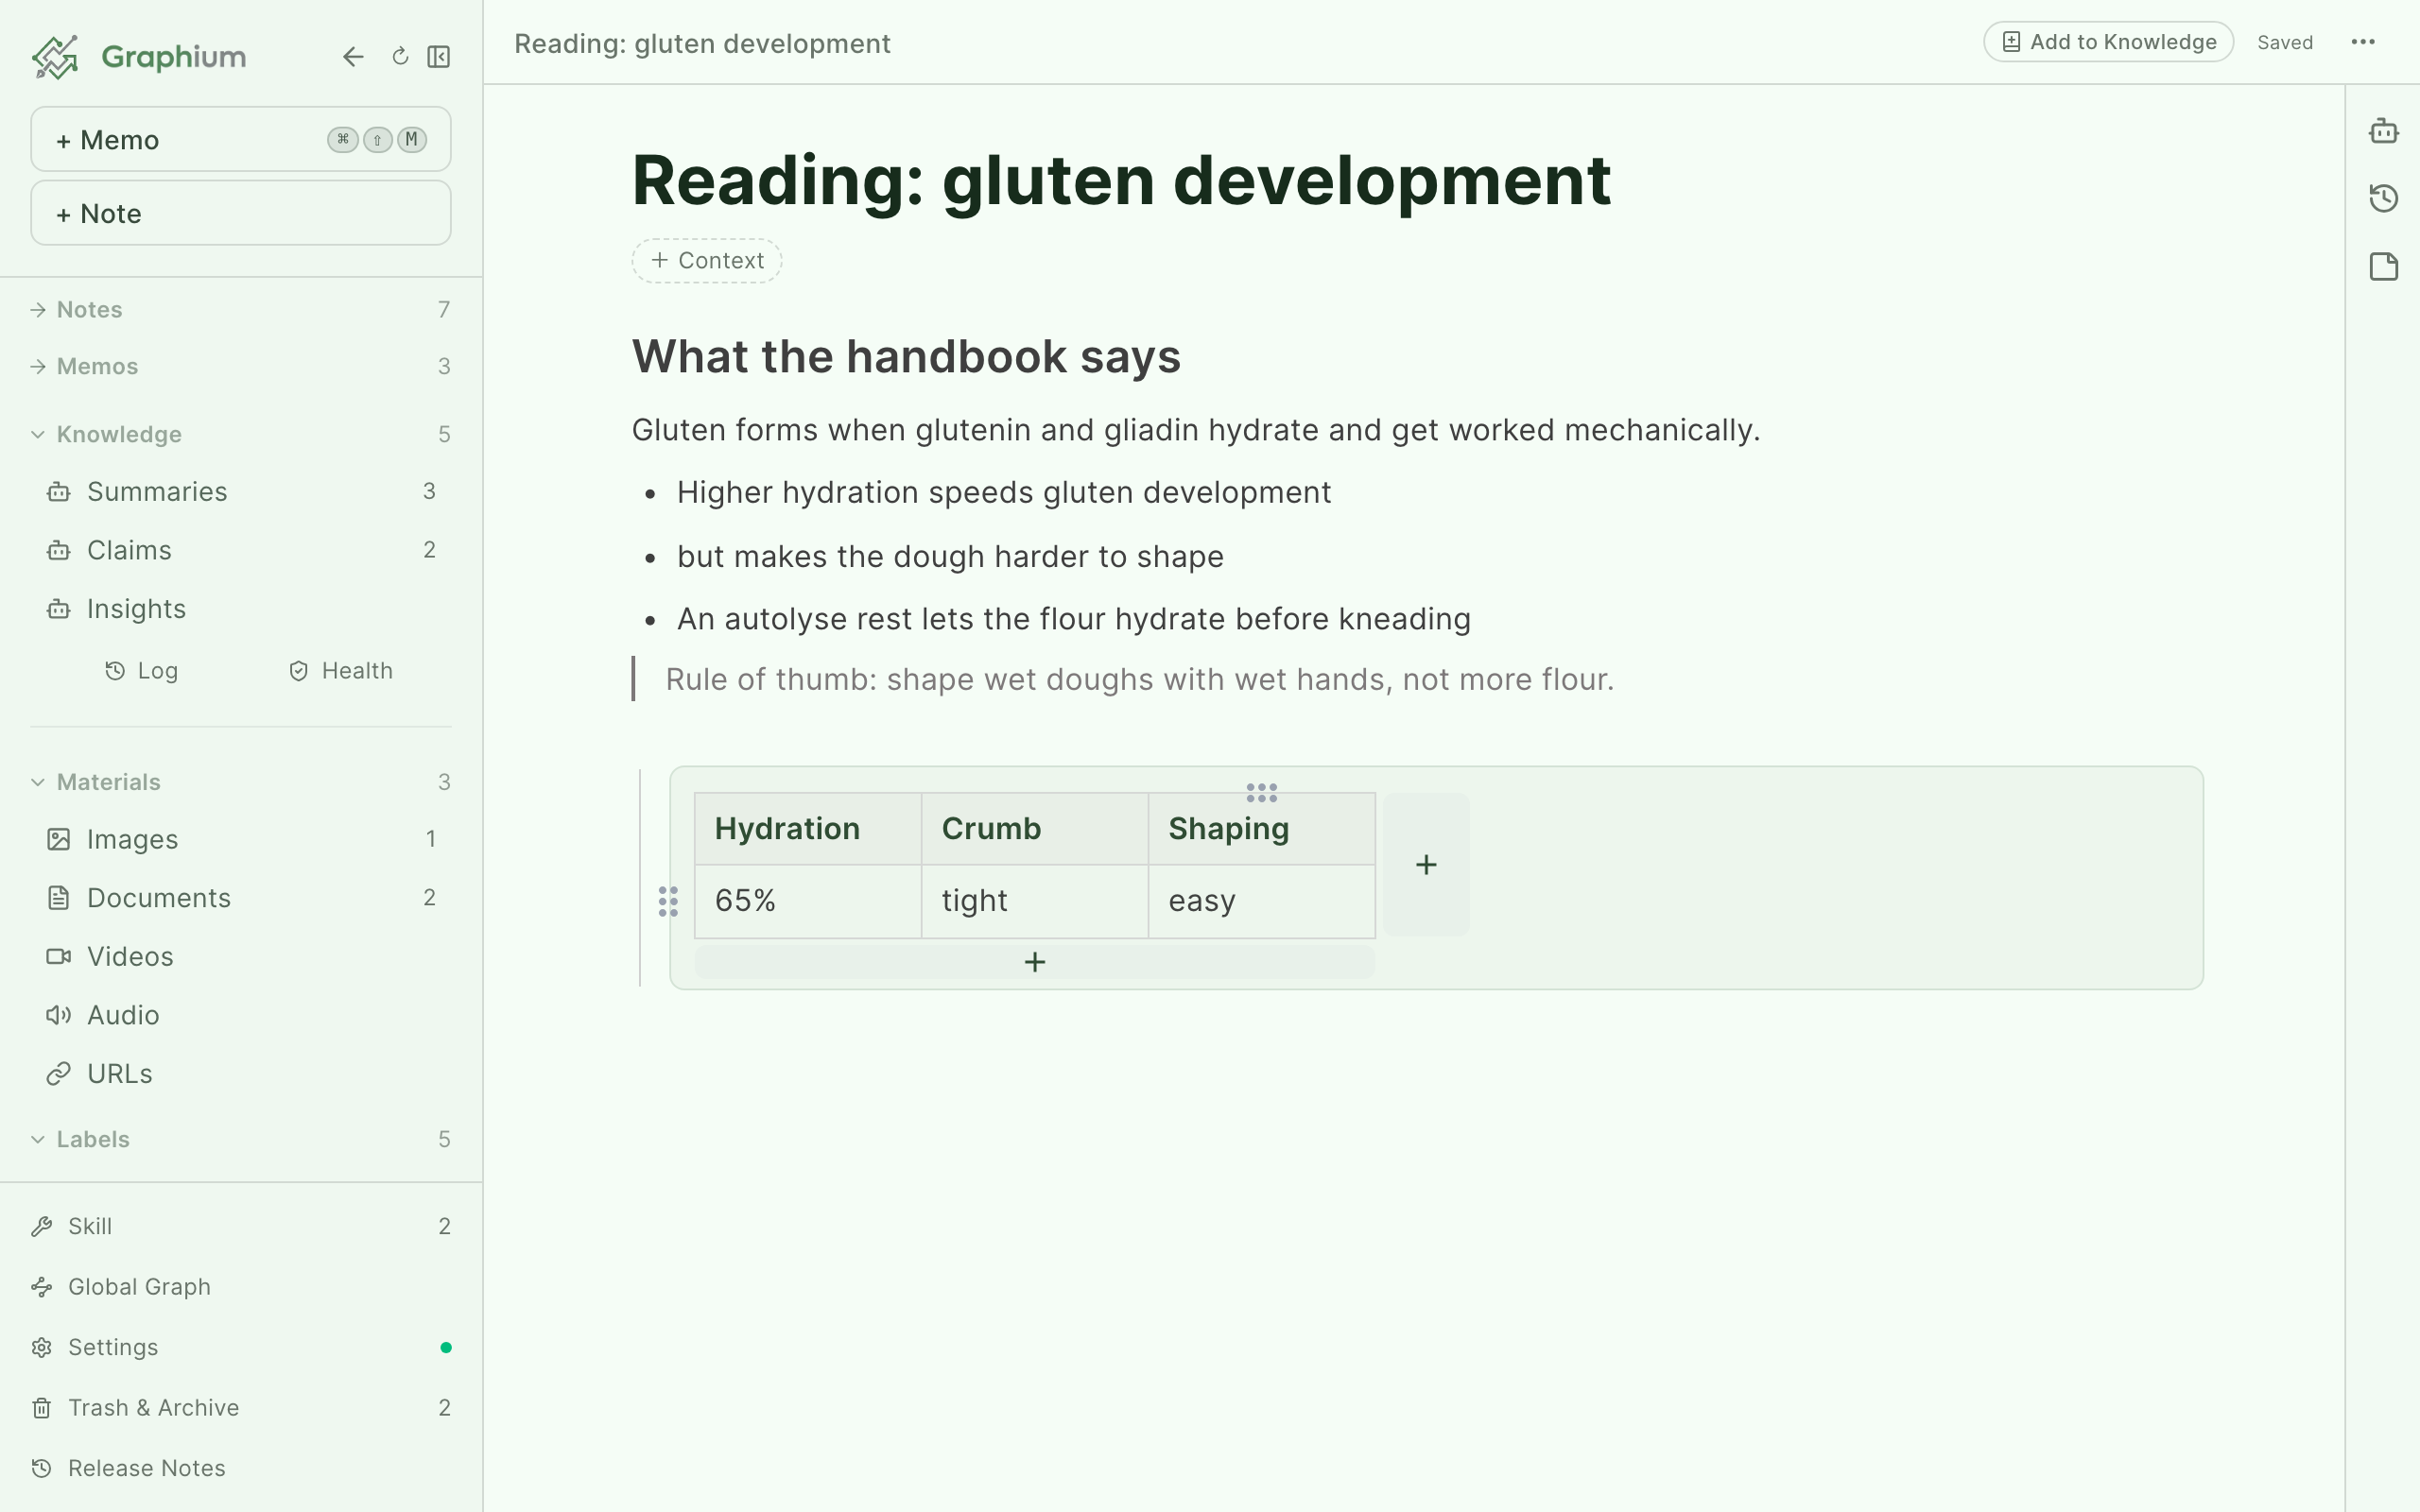
The editor is block-based: every paragraph, heading, or table is a block you can drag, style, and convert. Press / on an empty line to insert a block, or select text for the formatting toolbar. The standard building blocks are paragraphs, headings (three levels), bulleted, numbered, check and toggle lists, quotes, code blocks, and tables.
Readable line width Added in v0.32.0 (2026-08-13)
On wide screens the note body is capped at a readable column width and centered, so long lines stay easy to follow. Narrow windows, side peeks, and mobile are unaffected — the cap only kicks in when the window is wider than the column.
When a note needs the whole window — wide tables, charts, or images — open the ⋯ menu in the top-right corner and choose Full width. A check mark shows the current state, and the choice is saved per note.
Collapsing headings Added in v0.47.0 (2026-08-28)
Every heading folds away what sits under it. Hover a heading and a small ▸ appears to its left; click it to collapse. The arrow stays visible while a section is collapsed, so you can tell at a glance that something is folded there — otherwise it keeps out of the way and the heading reads as an ordinary heading.
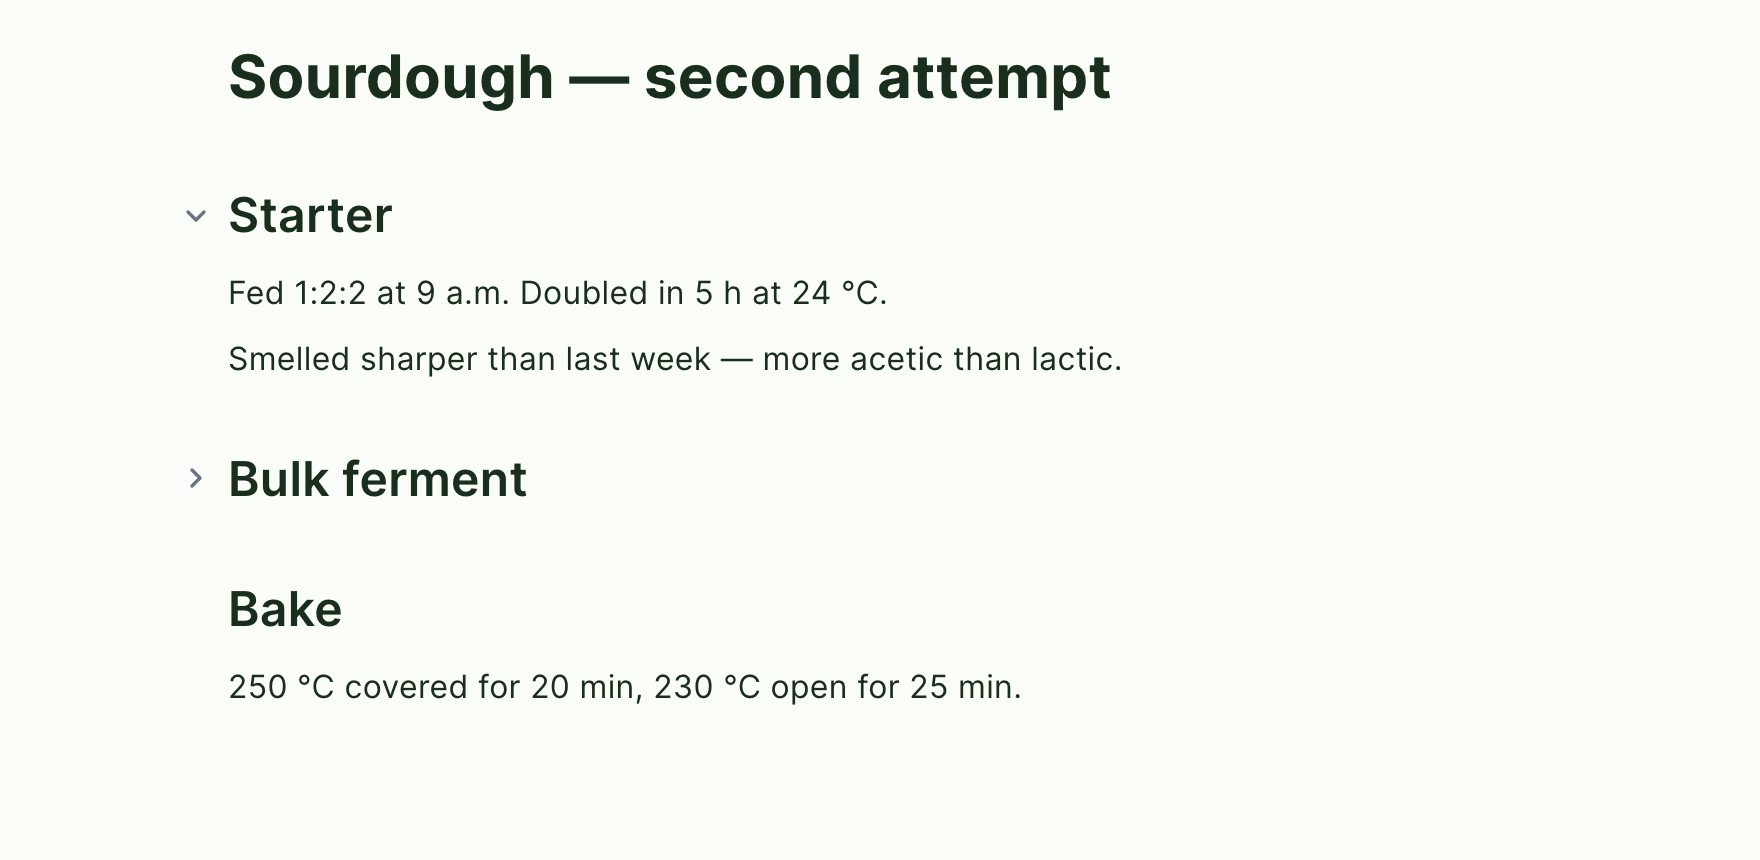
A heading takes everything down to the next heading of the same or higher level. Collapsing an H2 hides its paragraphs and any H3 sections beneath it, and stops at the next H2. A heading with nothing under it has no arrow.
Folding is a view setting, not part of the note. Nothing is written to the note file, so exports, Markdown, and the provenance graph always contain the full text. The folded state is remembered on this device only. While the in-note search (⌘F / Ctrl+F) has a term in it, folded sections are shown so that matches are never hidden from you.
The turn-into menu Added in v0.18.0 (2026-07-15)
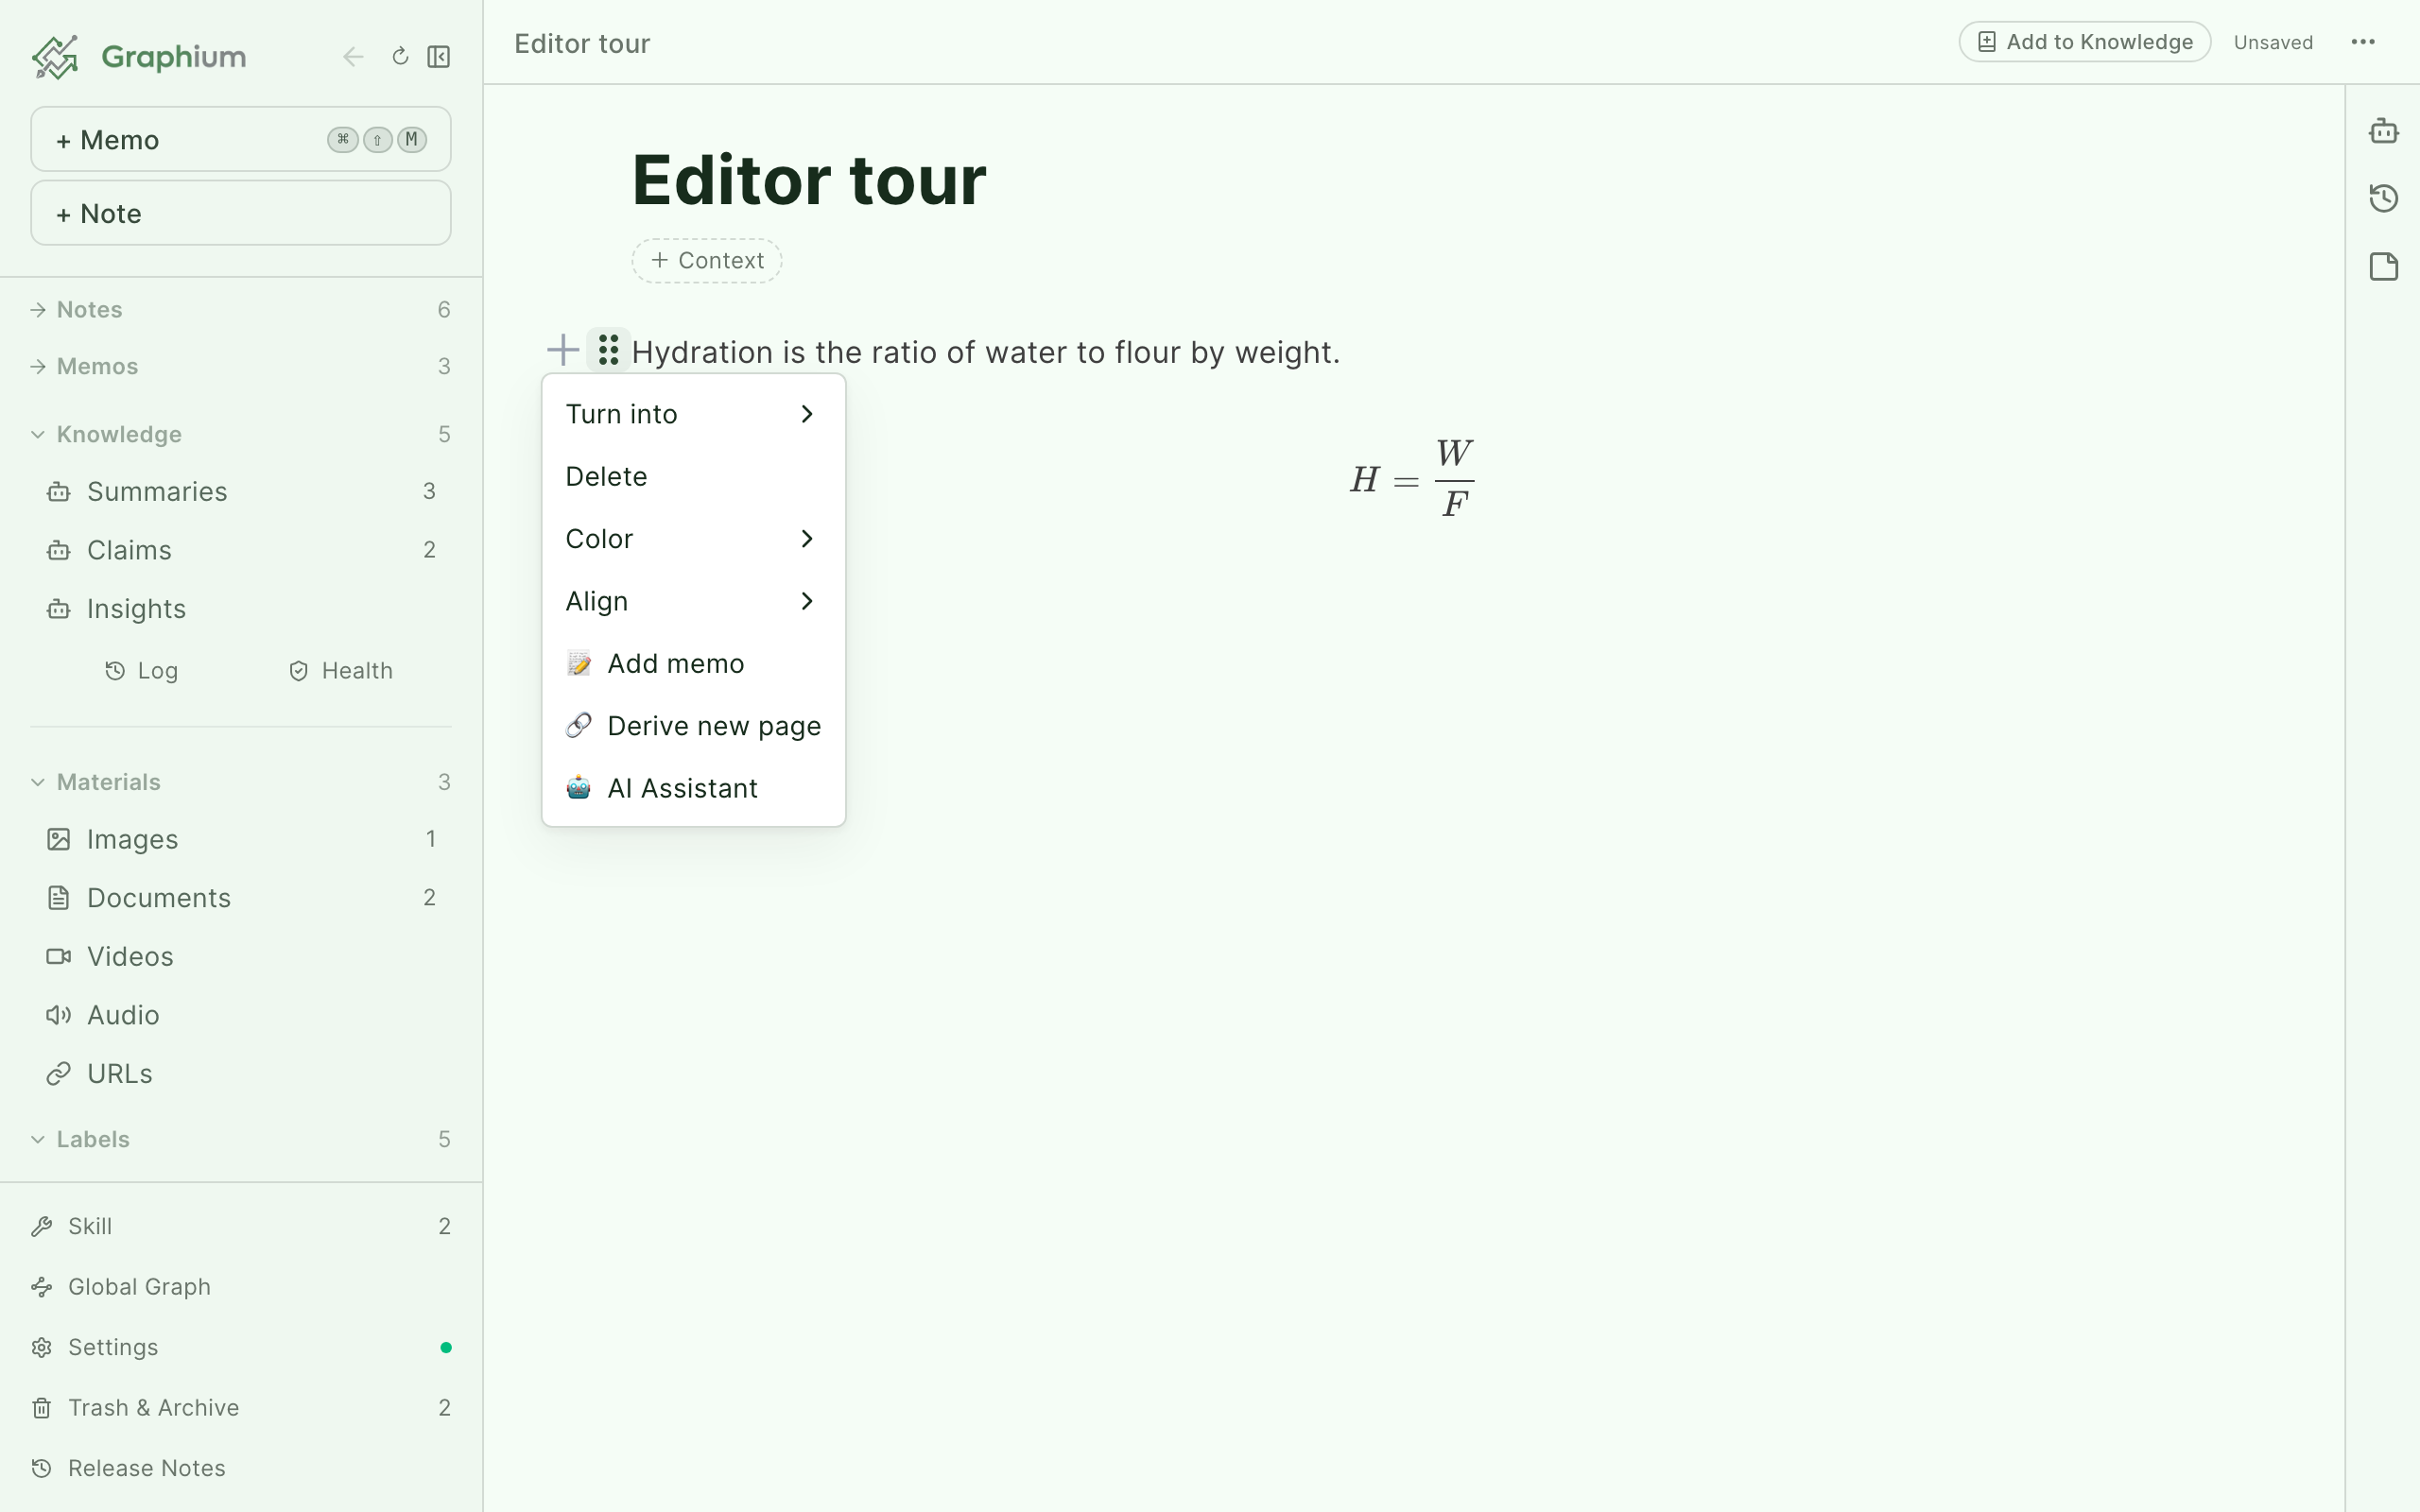
Hover a text block and open the drag-handle (⠿) menu; Turn into converts the block in place:
Text · Heading 1 · Heading 2 · Heading 3 · Bulleted list · Numbered list · Check list · Toggle list · Quote · Code
The drag-handle (⠿) menu
The full menu, top to bottom:
| Item | What it does |
|---|---|
| Turn into | Convert a text block to another type (see above). |
| Duplicate Added in v0.35.0 (2026-08-13) | Copy the block directly below it — see Duplicating a block. |
| Delete | Remove the block. |
| Color | Text and background color. |
| Align | Align left / Align center / Align right — works even for tables, audio, and file blocks. |
| Label | Mark a table or media block as an Entity in the provenance graph — see Labels & provenance. |
| Name this table | Give a table a name, shown above it where a caption belongs and used as its reference name in charts. Tables only. |
| Read text from image | On-device OCR for image blocks — see Materials & citations. |
| 📝 Add memo | Attach a memo to this block; it shows up in the Memos panel. |
| 🔗 Derive new page | Fork a new note that records where it came from. |
| 🤖 AI Assistant | Ask AI about this block (headings and steps pass their whole section). Hidden until AI is set up — see AI setup. |
Slash menu reference
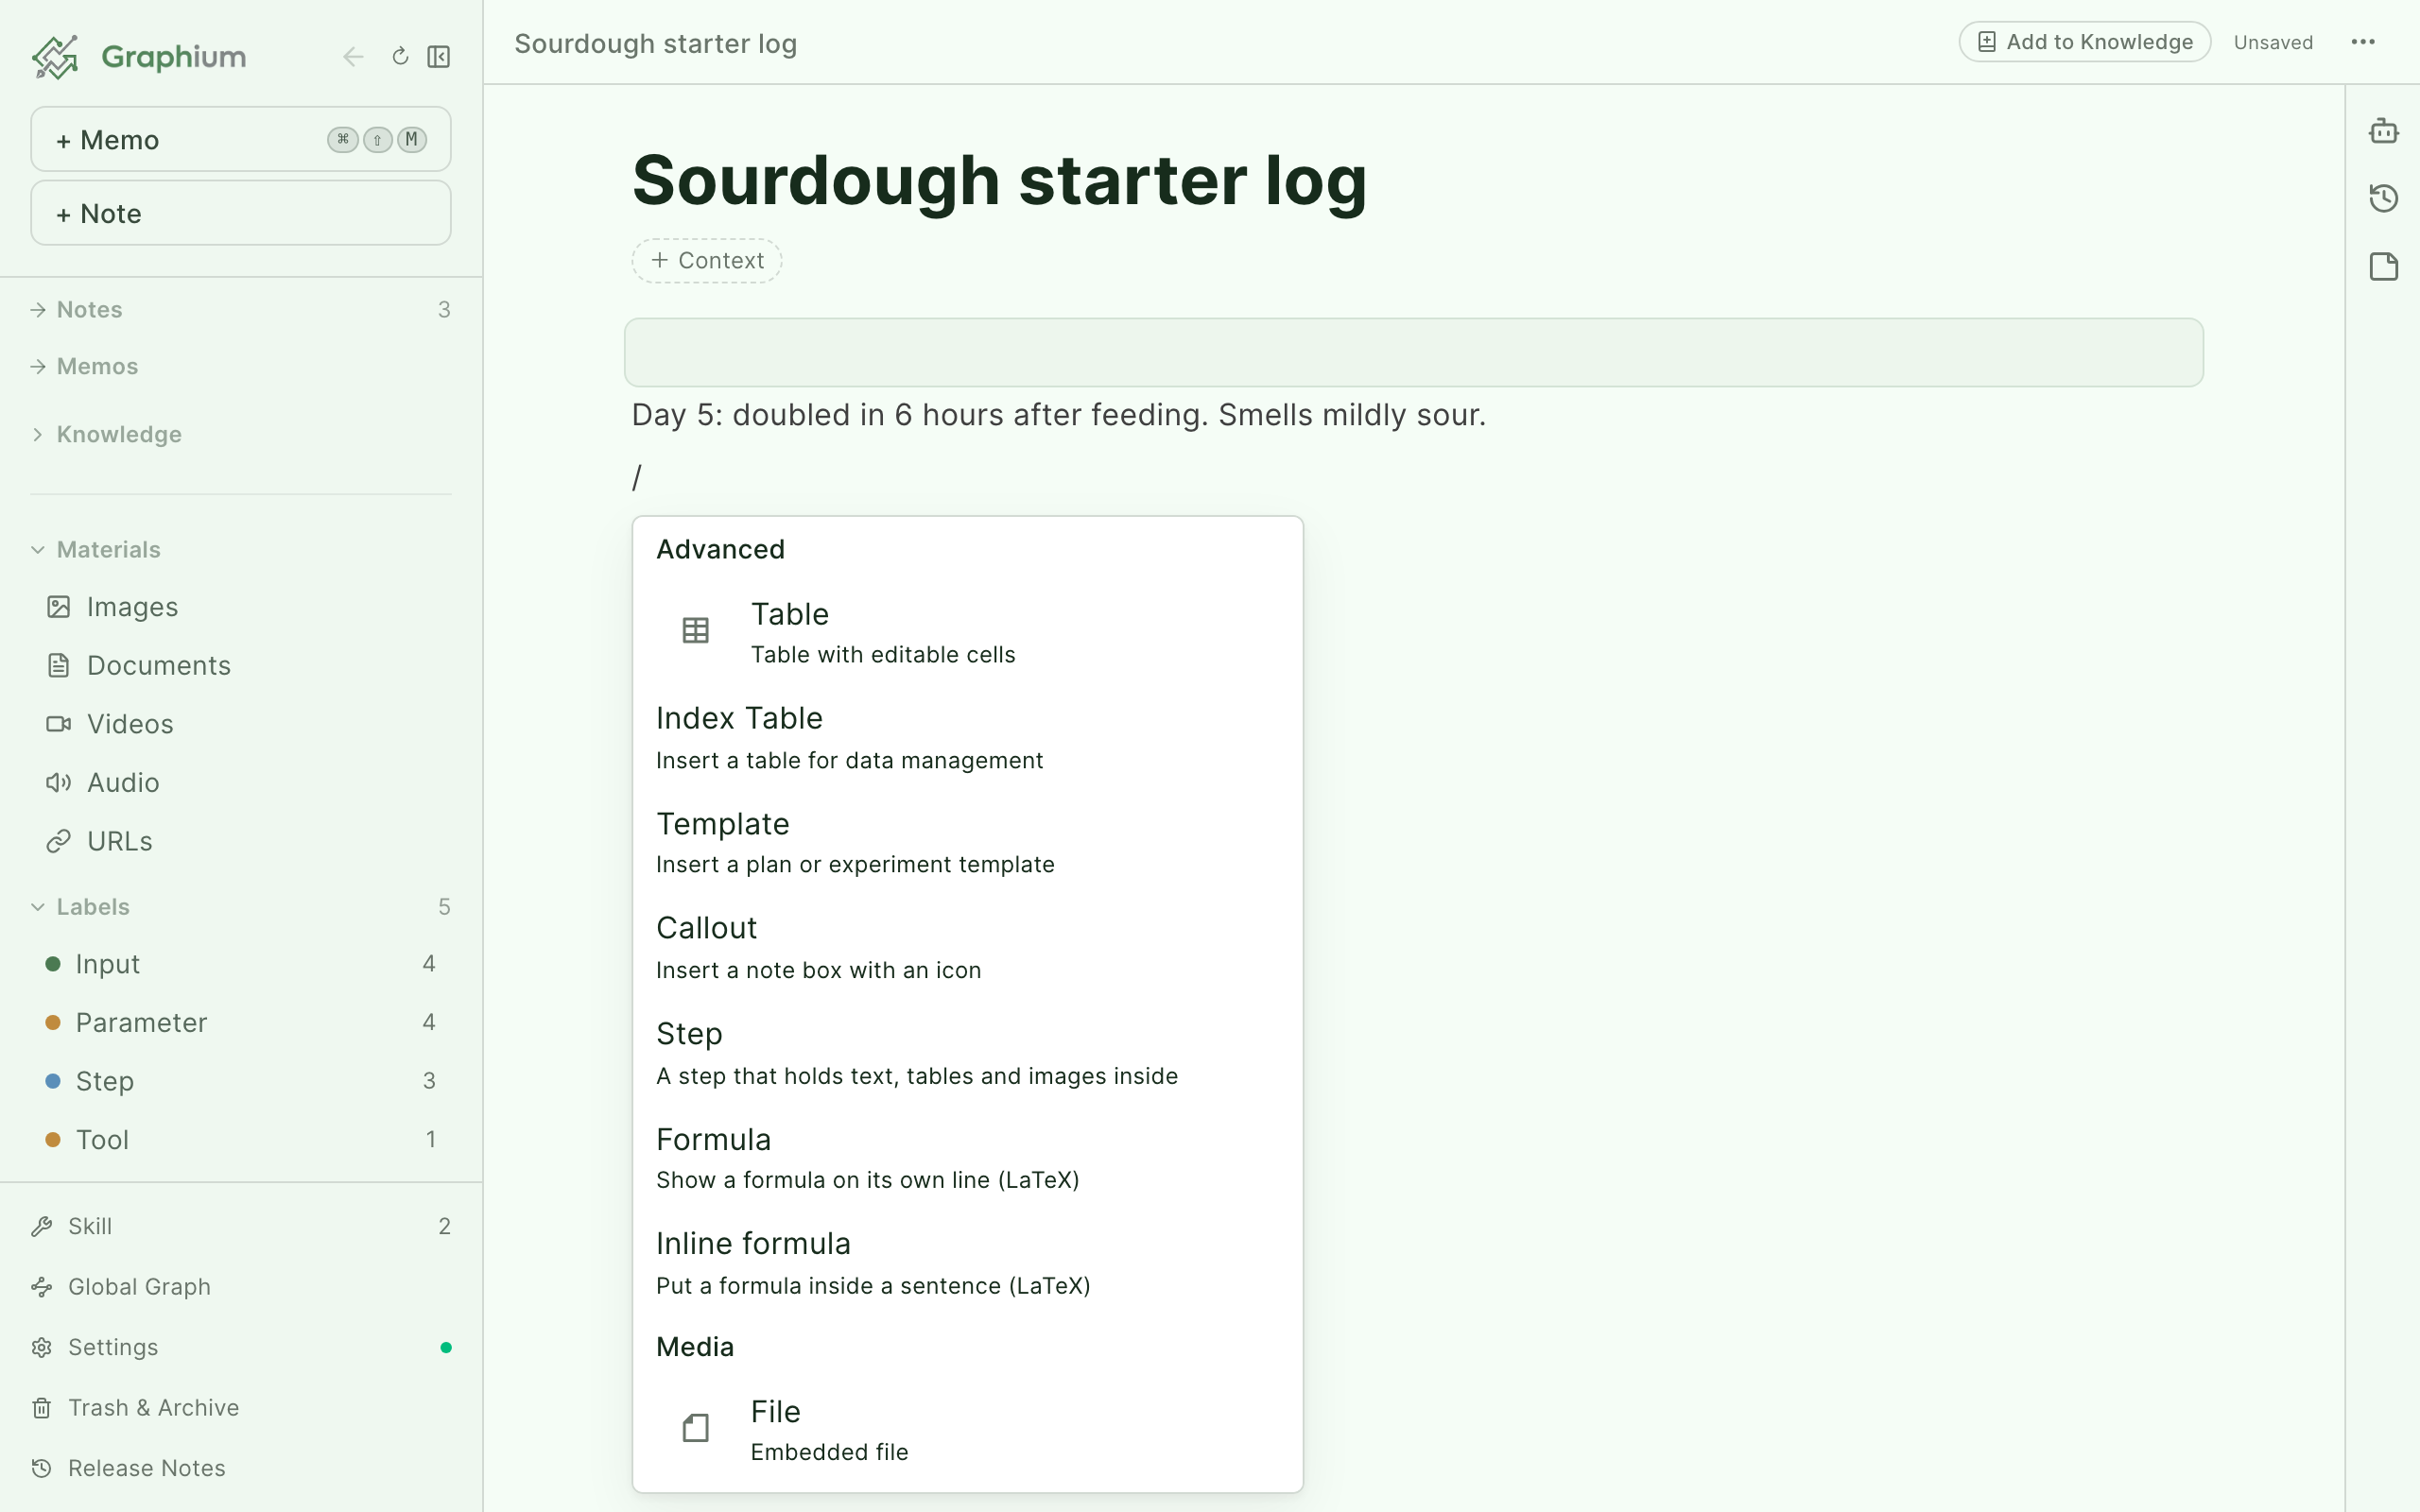
Typing / shows the standard blocks plus four Graphium-specific groups:
Advanced
| Item | Description |
|---|---|
| Calculation Added in v0.35.0 (2026-08-13) | "Live calculations with variables and units" — see Calculations |
| Index Table | "Create and open a note for each row" — see The index table |
| Time-series Table | "Rows get the date/time automatically — for diaries and daily logs" — see The time-series table and charts |
| Chart | "Visualize a table in this note" — see The time-series table and charts |
| Template | "Insert a plan or experiment template" |
| Callout | "Insert a note box with an icon" |
| Step | "A step that holds text, tables and images inside" — the container behind the provenance graph; see Labels & provenance |
| Columns | "Place blocks side by side in two columns" — see Columns |
| Formula | "Show a formula on its own line (LaTeX)" |
| Inline formula | "Put a formula inside a sentence (LaTeX)" |
Existing media
| Item | Description |
|---|---|
| Image | "Upload new or insert existing image" |
| Video | "Upload new or insert existing video" |
| Audio | "Upload new or insert existing audio" |
| Document | "Upload new or insert existing PDF / Word" |
| Bookmark | "Display URL as a card" |
| "Embed a PDF file" | |
| Memo | "Insert from saved memos" |
Existing knowledge
| Item | Description |
|---|---|
| Claims | "Cite existing claim notes (multi-select)" |
| Insights | "Cite existing insight notes (multi-select)" |
These cite notes from your Knowledge layer.
Notes
| Item | Description |
|---|---|
| New note | "Create a named note and link it here" |
Math Added in v0.24.0 (2026-07-30)
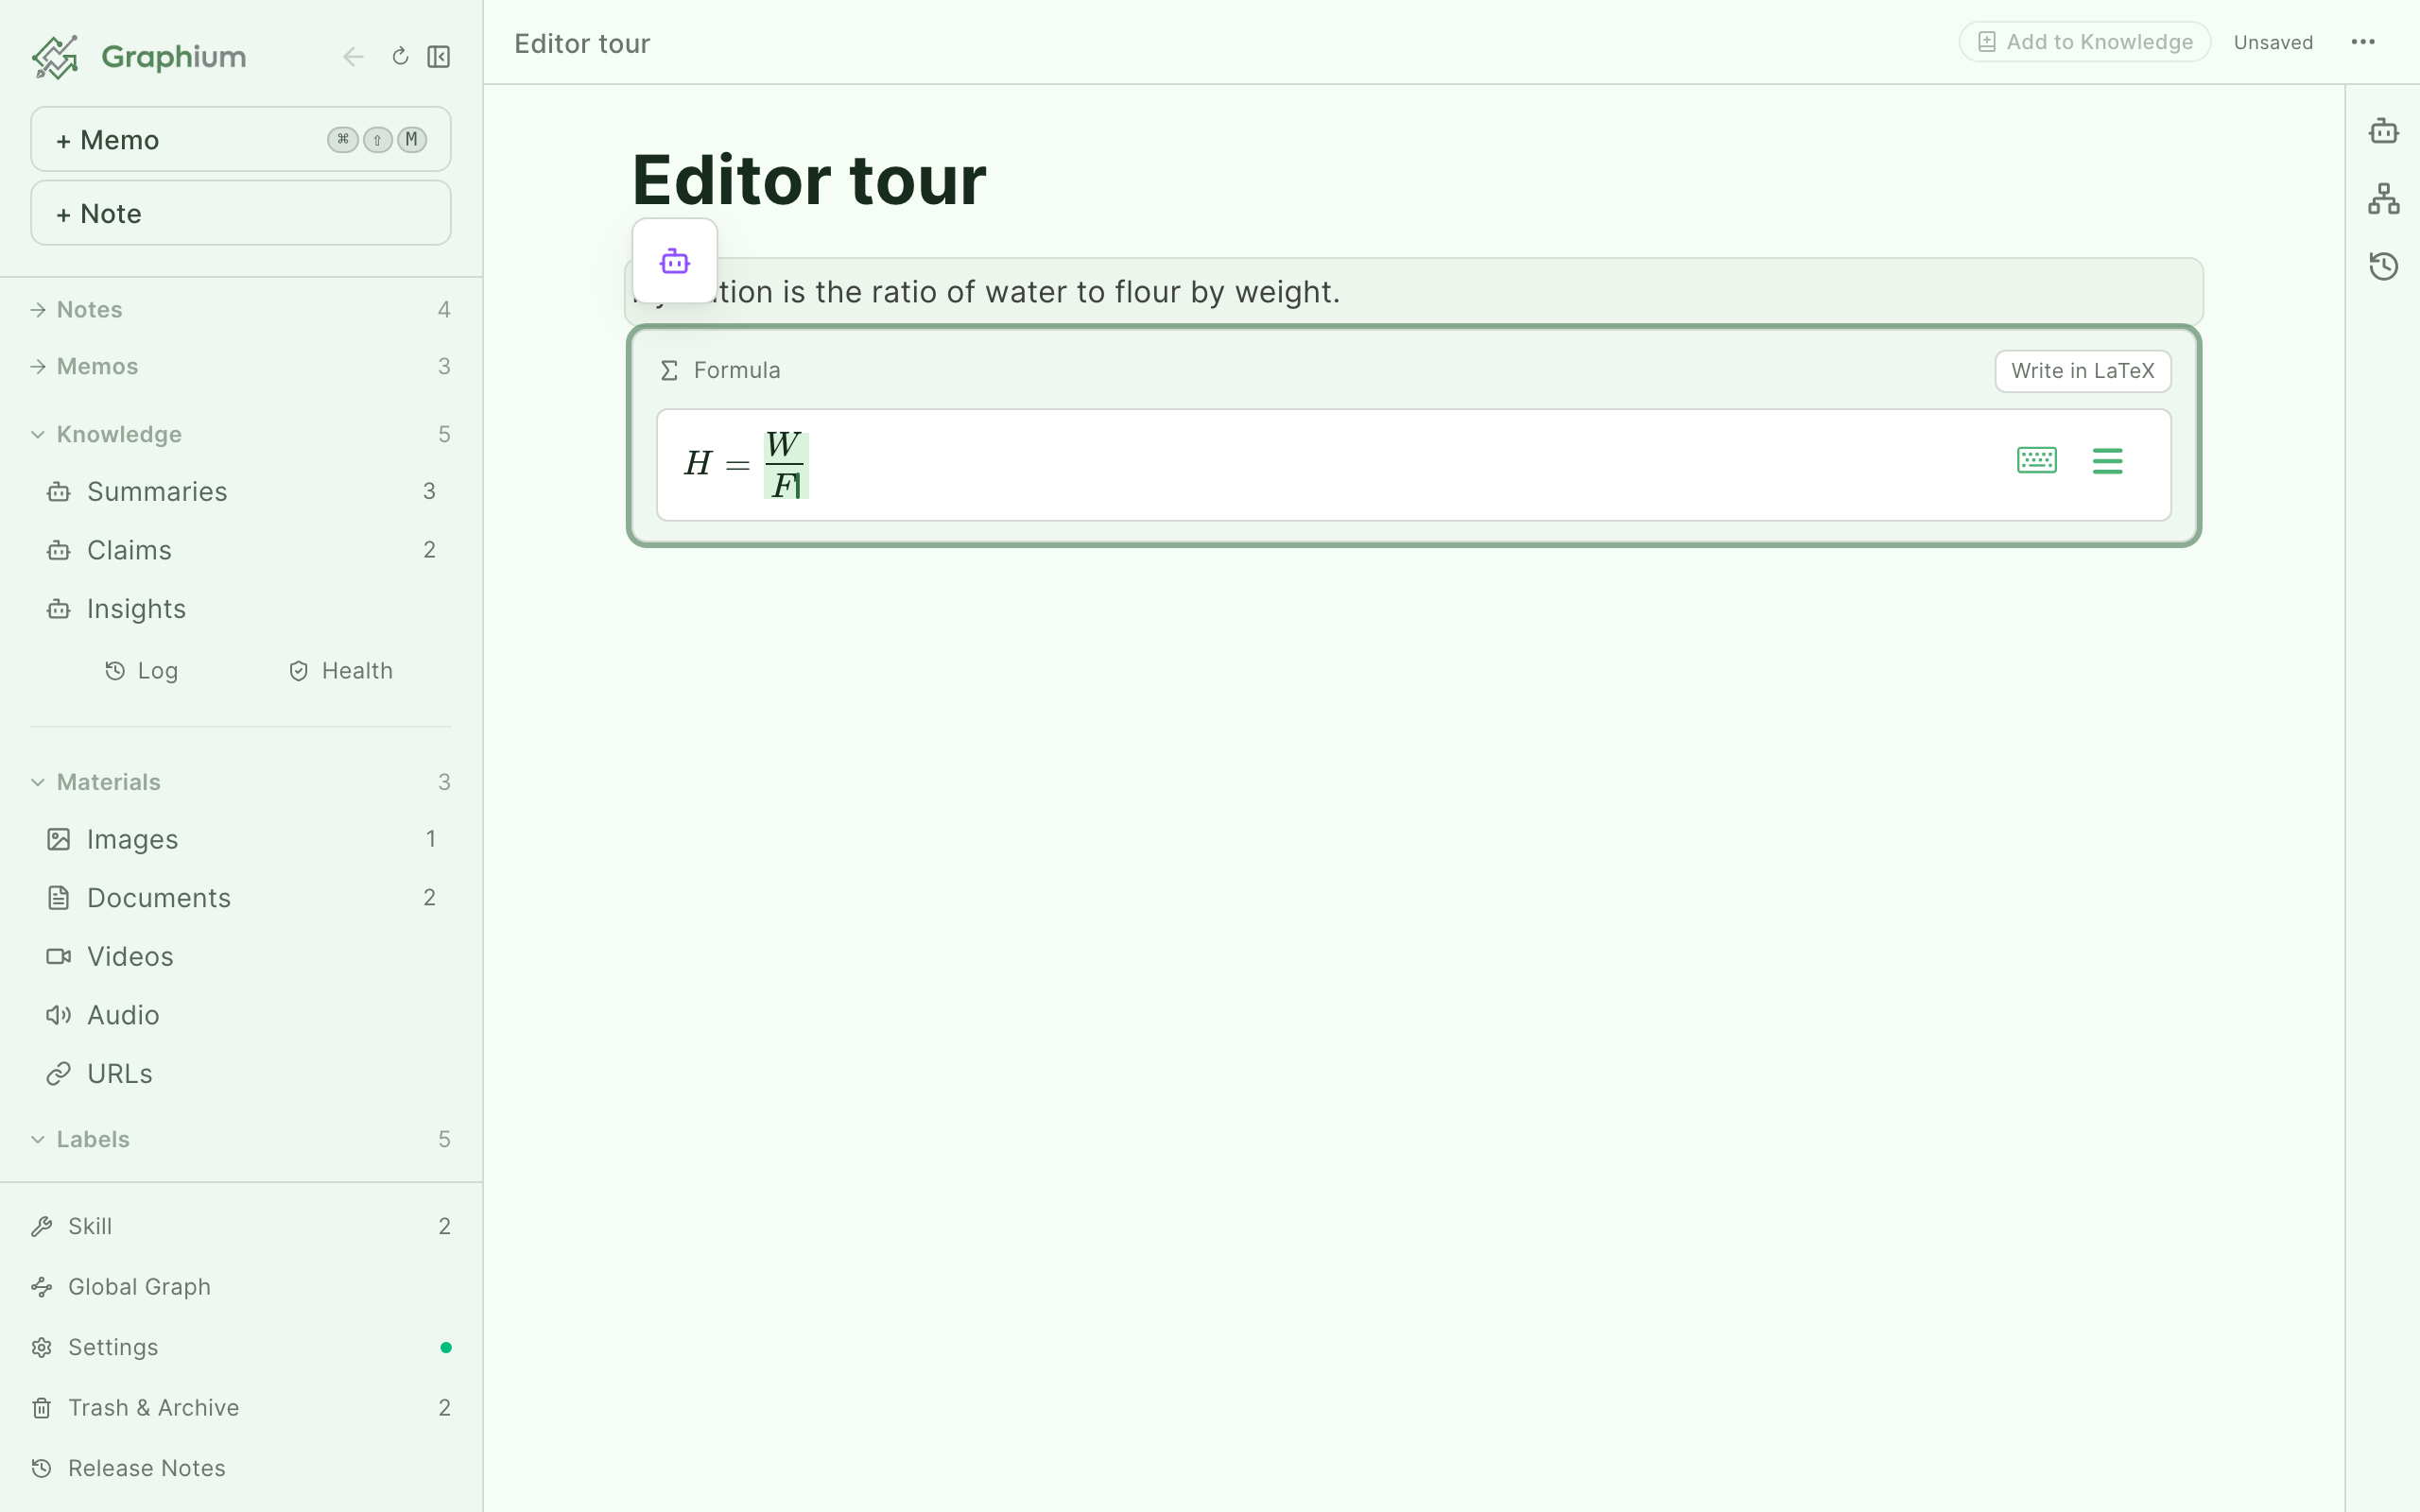
Formula inserts a display equation on its own line; Inline formula drops one into a sentence ("Click to edit"). Both open an editor with two modes you can switch between at any time:
- Write with symbols — a visual math editor: type
x/yto get a fraction, with a symbol palette for the rest. - Write in LaTeX — edit the LaTeX source directly ("Enter a formula (LaTeX)").
Your last-used mode is remembered on this device. Formulas are stored as LaTeX and rendered with KaTeX, so they survive export as plain LaTeX math delimiters.
Calculations Added in v0.35.0 (2026-08-13)
A formula shows the reader what you did. Calculation (/calculation) actually does the arithmetic — the weighing, the dilution, the yield you would otherwise work out on a phone calculator and type in as a bare number.
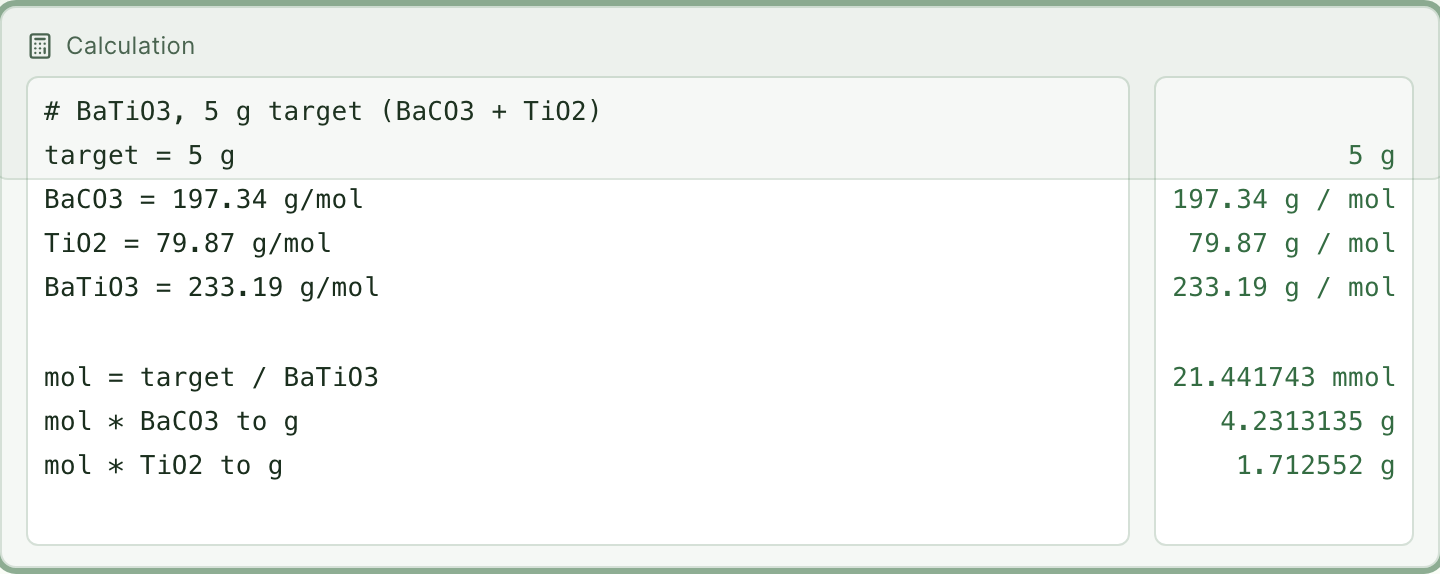
Write one expression per line on the left. Results appear in the column on the right and update as you type — a weighing for 5 g of BaTiO₃ reads like this:
| Line | Result |
|---|---|
target = 5 g | 5 g |
BaCO3 = 197.34 g/mol | 197.34 g / mol |
BaTiO3 = 233.19 g/mol | 233.19 g / mol |
mol = target / BaTiO3 | 21.441743 mmol |
mol * BaCO3 to g | 4.2313135 g |
What the block understands:
- Variables.
target = 5 gnames a value that later lines can use. The names are yours; nothing is predefined. - Units. Values carry their units through the arithmetic, so
5 g / 233.19 g/molgives you an amount of substance rather than a naked number — shown with whichever prefix reads best (21.441743 mmol, not0.021441743 mol). Convert explicitly withto:mol * BaCO3 to g,1 atm to kPa. - Comments. Blank lines pass through, and a line starting with
#or//is a note to yourself. - Click a result to copy it. The line says Click to copy, then Copied.
Variables live inside the block. A second Calculation block starts from nothing, so two calculations in one note cannot quietly contaminate each other. A line that doesn't parse is marked ?, and the lines around it keep evaluating.
The note stores both the expressions and the values they produced. That matters for a lab record: the numbers you worked with stay readable years later, even if the maths library underneath changes.
Duplicating a block Added in v0.35.0 (2026-08-13)
Duplicate in the drag-handle (⠿) menu, or ⌘D (Ctrl+D on Windows/Linux) with the cursor in the block, copies a block directly below itself. It is the fastest way to repeat a filled-in table, a step, or a calculation you want to vary.
The copy is a real copy, not a link: editing one leaves the other alone. It carries over the block's content, its labels and step attributes, its alignment, and — for a time-series table — the table's registration and name, since duplicating a set-up table as a template is the common reason to do this.
Two things deliberately do not come along:
- An index table's registration. Its rows belong to notes, and two tables pointing at the same notes would leave you unsure which one you edited. The copy is a plain table.
- OCR text on an image. The same image can be read again in place; derived data is not kept in two places.
Columns Added in v0.27.0 (2026-08-03)
Columns places blocks side by side — observations next to their discussion, a table next to the photo it describes. Insert one from the slash menu (/columns) and you get two columns, each holding any blocks you like: paragraphs, headings, tables, images, even steps.
- Create by dragging — grab a block by its handle (⠿) and drop it on the left or right edge of another block: a vertical drop cursor appears and the two become columns. Dropping on the edge of an existing column (or in the gap between columns) adds a new column there instead.
- Resize — drag the gap between two columns to change their widths.
- Move blocks in and out — drag a block by its handle (⠿) into a column, or use Backspace / Delete at a column edge to merge content across the boundary. Dragging the last block out of a column dissolves the column.
- Narrow layouts stack — when the note is too narrow to fit the columns side by side (the side peek, a phone), they stack vertically on their own. Nothing is hidden.
Columns are layout only: search, the outline, AI chat, and Markdown export all read the content inside them just as if it were written top to bottom.
Update all your devices first
Opening a note that uses columns in an older version of Graphium silently removes the columns and everything inside them on the next save — older versions do not know the block type. If you use Graphium on several devices, update all of them before you start using columns.
Callout, bookmark, and PDF
- Callout is a note box with an icon; pick a variant: Note, Info, Success, Warning, or Danger.
- Bookmark shows a URL as a card ("🔗 Enter a URL"); inserting one opens a picker so you can reuse an already-registered URL.
- PDF embeds a PDF right in the note ("Drag & drop a PDF file, or insert one from the slash menu").
Inserting media
Image, Video, Audio, and Document all open the same picker: choose Upload from file for something new, or select a material you have already imported. The Insert as switch controls the result — Embed ("Expand the content inline in the note") or Link ("Insert as an @link (content stays collapsed)"). Everything you upload also lands in the material library — see Materials & citations.
Templates
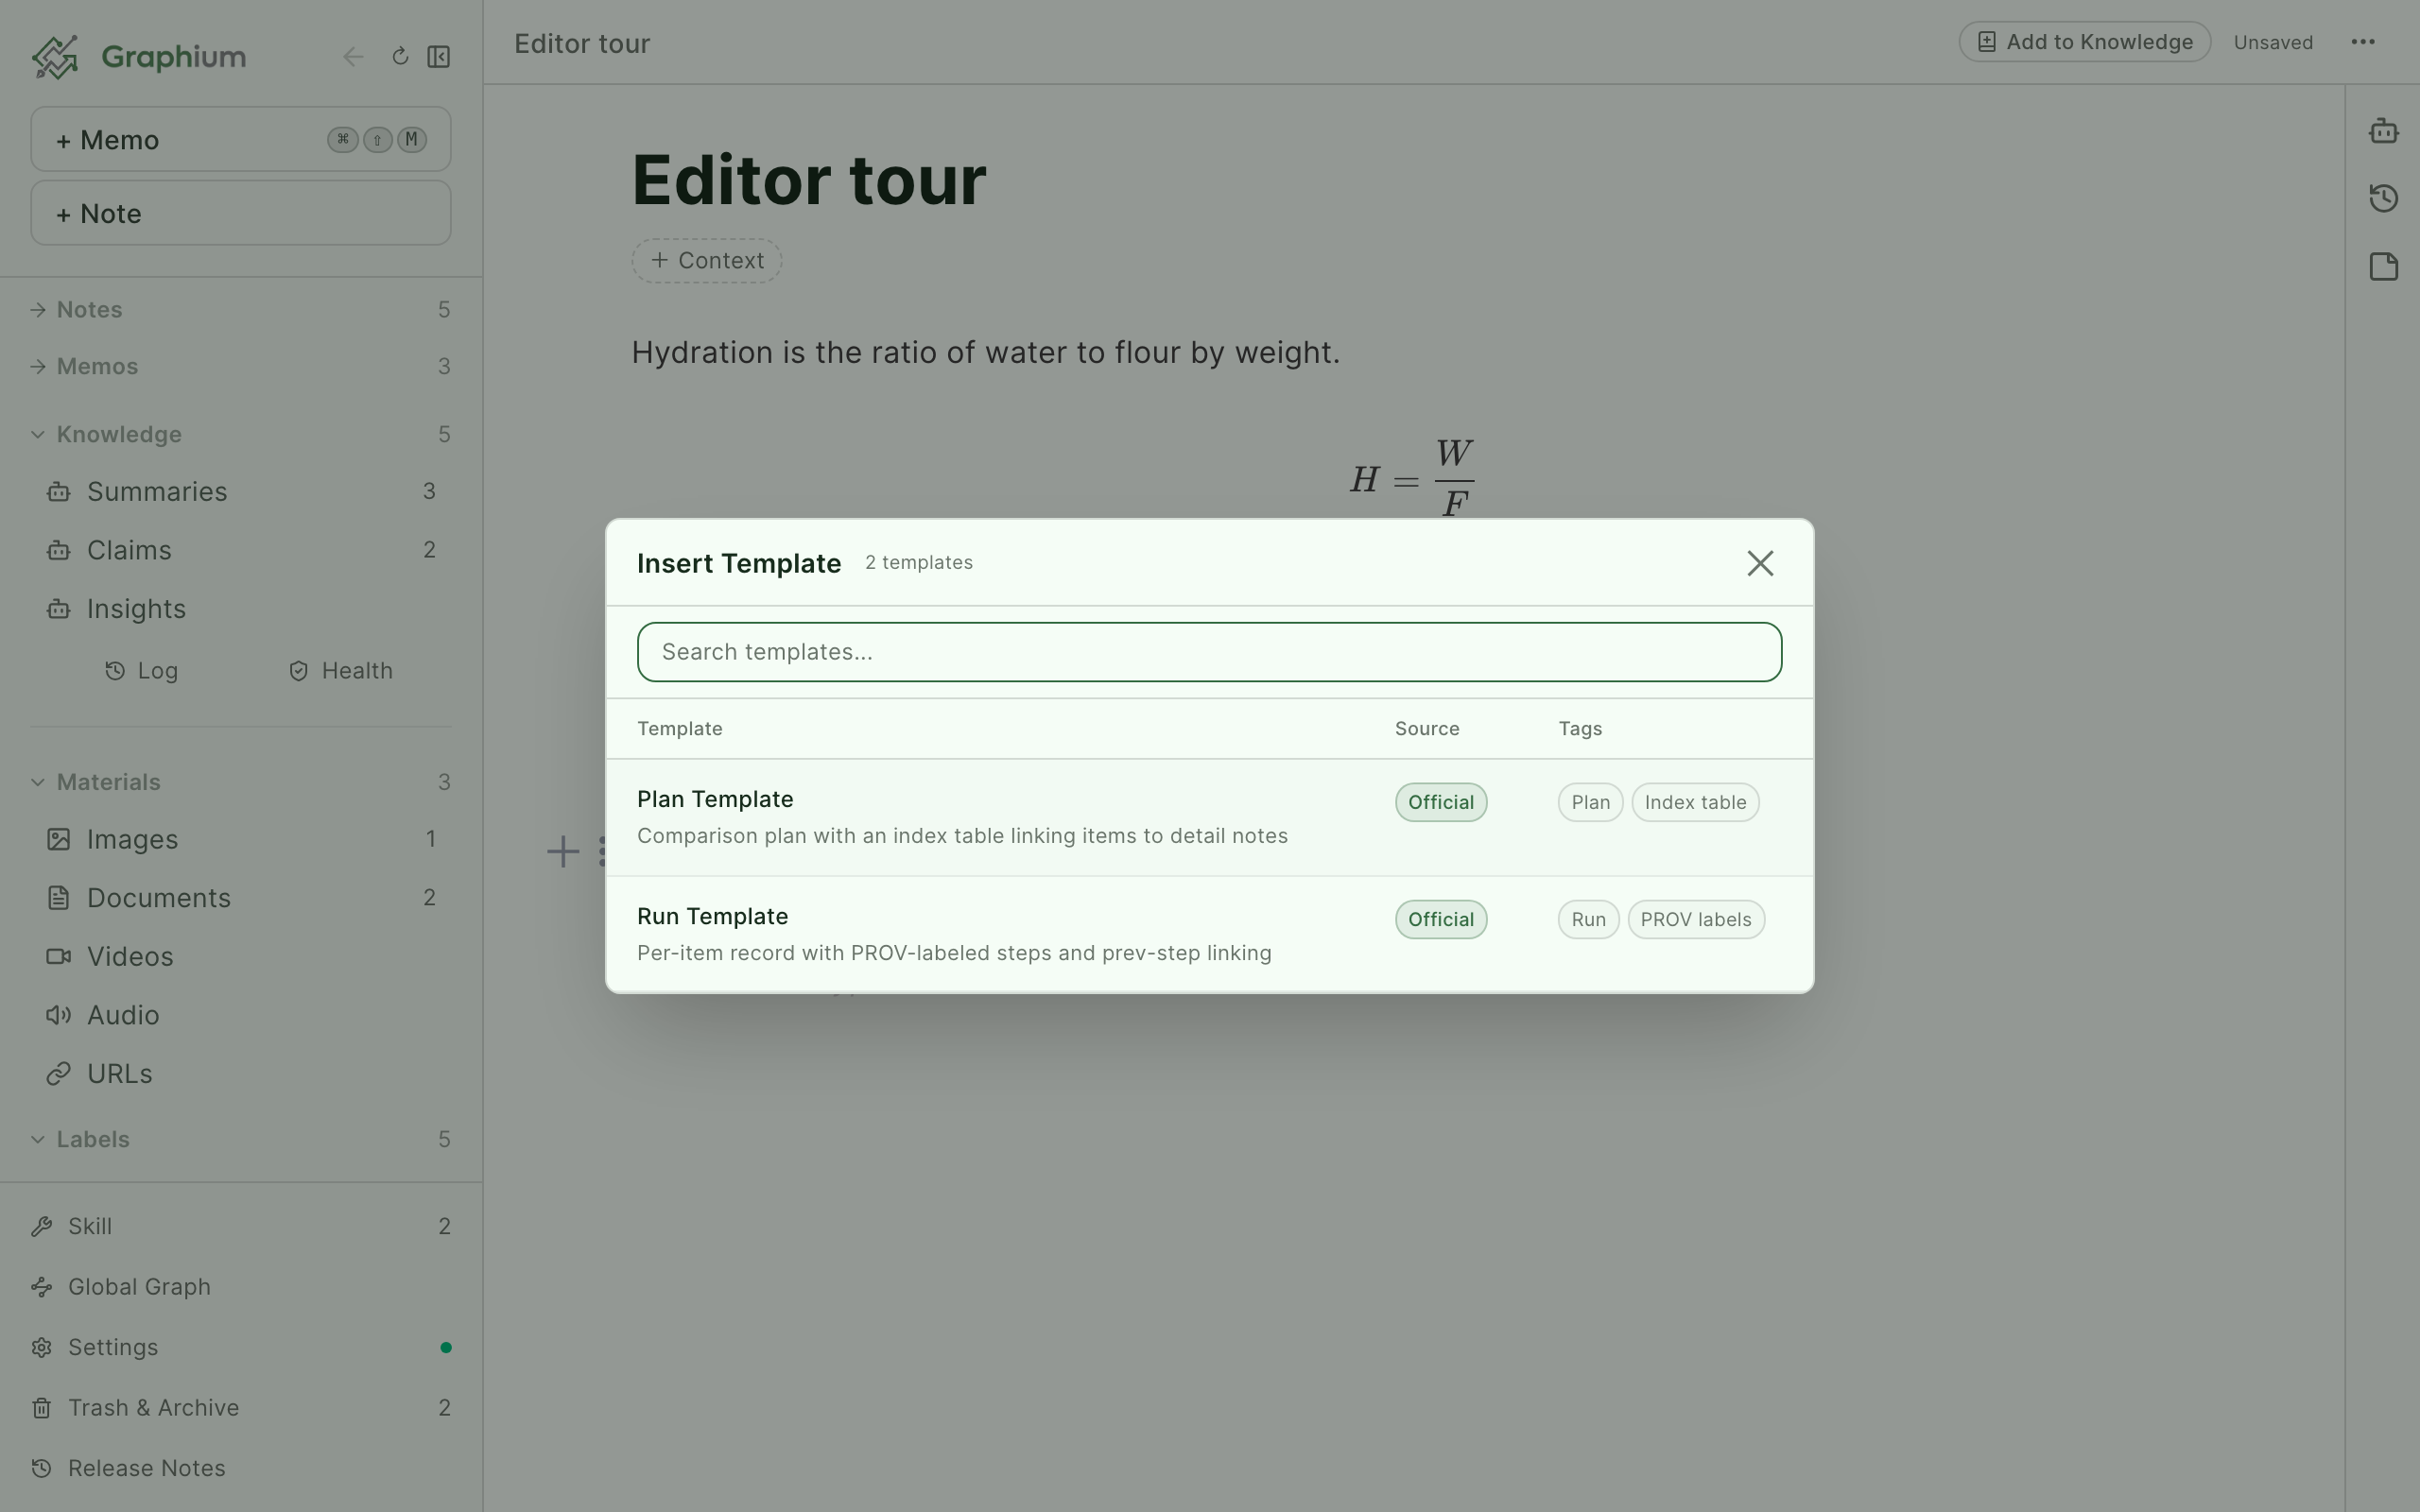
Template opens the Insert Template modal with two built-in layouts:
| Template | What you get |
|---|---|
| Plan Template | "Comparison plan with an index table linking items to detail notes" |
| Run Template | "Per-item record with PROV-labeled steps and prev-step linking" |
The modal is searchable and lists each template's Source (Official or User) and Tags. The two templates are designed as a pair: plan the comparison in one note, then generate a Run note per row of its index table.
The index table
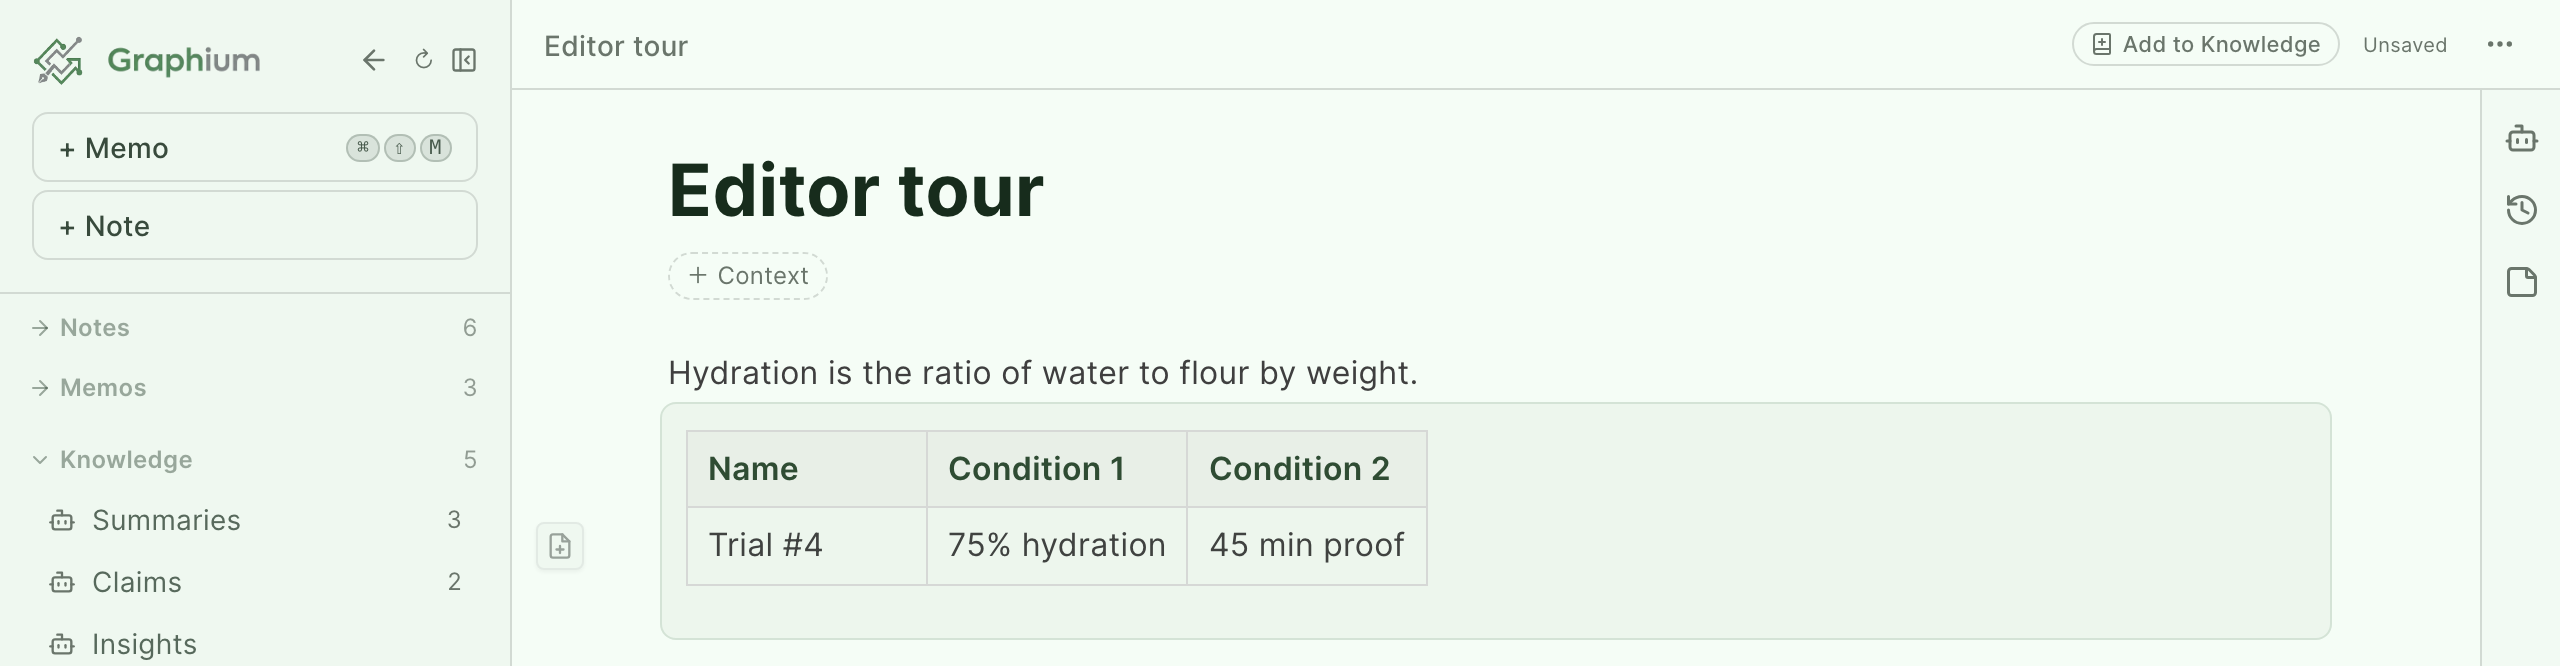
Index Table inserts a table built for managing a list of samples, runs, or items, with Name, Condition 1, and Condition 2 columns you can rename and extend. Each row can own a note:
- Fill the first column, then click the row's icon ("Create note for A-01") to generate a linked note for that row. An empty first column shows "Enter the note title in the first column" instead.
- Typing
@inside a row's first column links the row to an existing note instead. - Linked rows offer Open note and Side peek — the side peek opens the row's note next to the current one, so you can update a run without leaving the plan.
Like the time-series table, an index table is not a separate kind of table — it is an ordinary table with the row-to-note behavior switched on. Any existing table can become one (and stop being one) from the drag-handle (⠿) menu: "Turn into index table". Turning it off removes the row-to-note links (the notes themselves are untouched).
The time-series table and charts Added in v0.34.0 (2026-08-13)
Time-series Table inserts a table for recurring, time-stamped records — a headache diary, a growth log, a daily measurement. It starts with Date/Time, Value, and Note columns you can rename and extend. There is no special button: add rows the way you add rows to any table (the + strip under the table, or pasting), and the current date and time is filled into the first column automatically.
The timestamp is ordinary cell text. You can edit it afterwards (recording last night's episode the next morning is fine), and because the whole thing is a standard table, it exports to Markdown and PDF unchanged.
Any table can be named from the drag-handle (⠿) menu — "Name this table" — and the name appears above it, where a caption belongs. Charts use it as the reference label. Time-series tables fall back to an automatic Table 1, Table 2, … in document order when they have no name of their own; other tables simply show nothing until you name them. Clear the name to remove it.
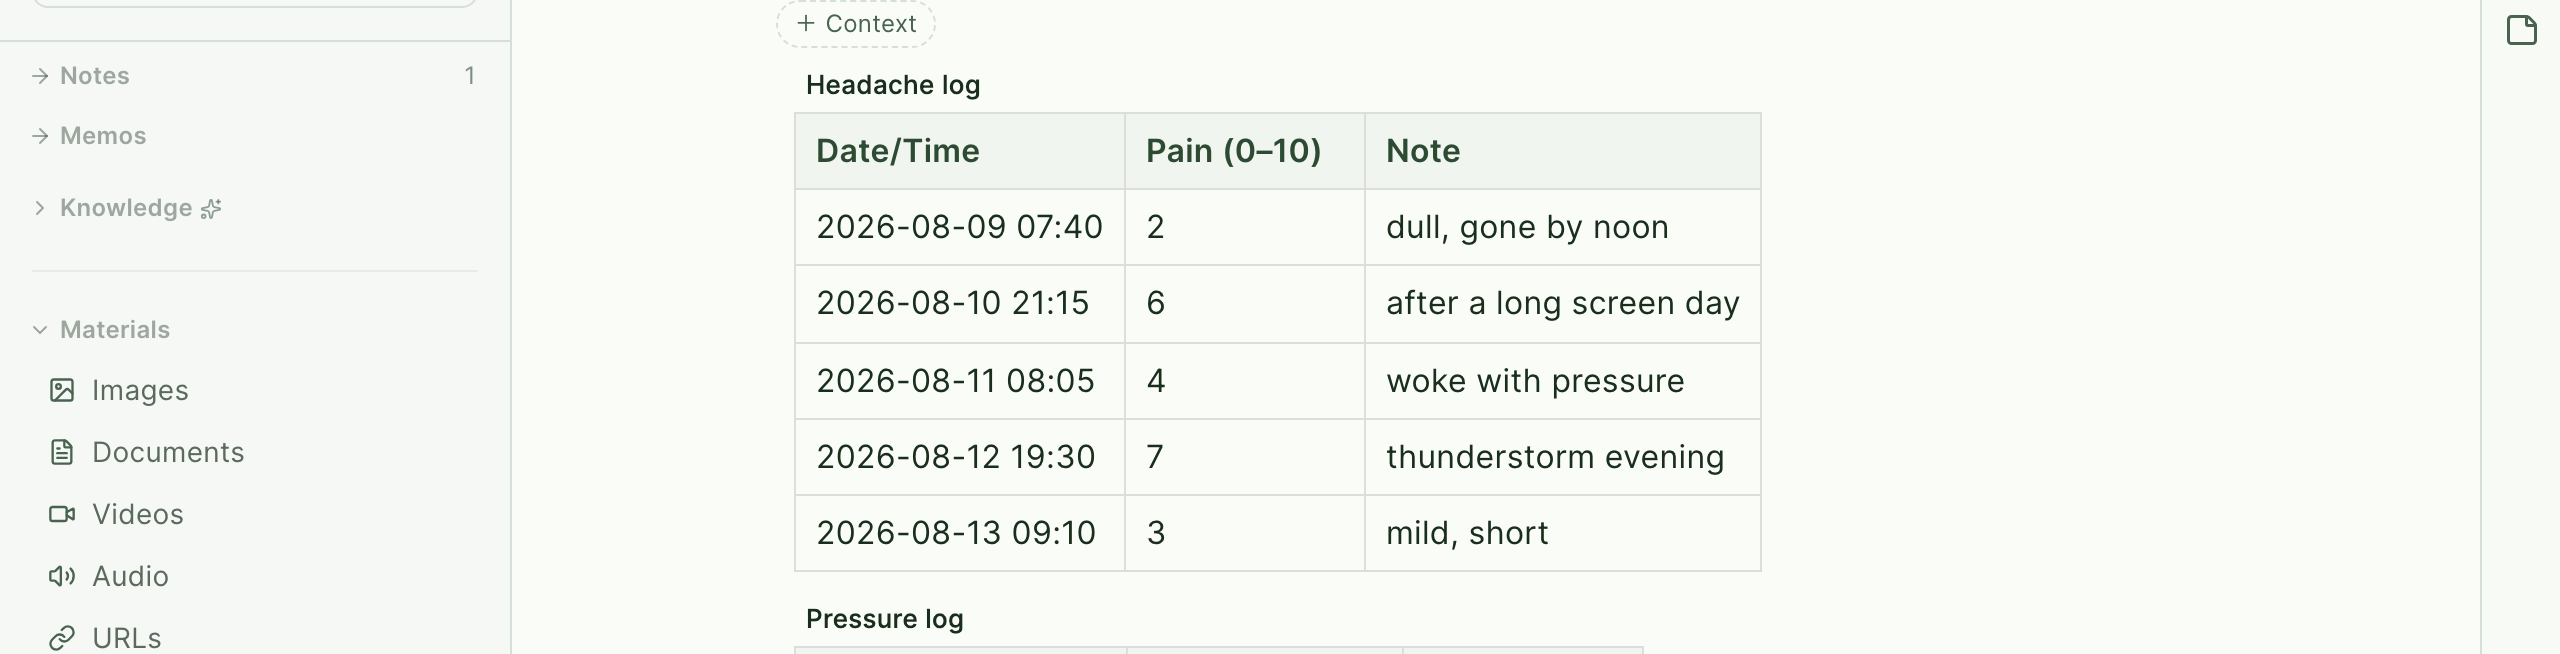
A time-series table is not a separate kind of table — it is an ordinary table with this behavior switched on. Any existing table can become one (and stop being one) from the drag-handle (⠿) menu: "Turn into time-series table".
Chart turns any table in the note into a graph, drawn in a publication style — a framed plot area with inward ticks, axis labels, and an A-series (√2:1) aspect ratio — so the figure looks at home in academic writing.
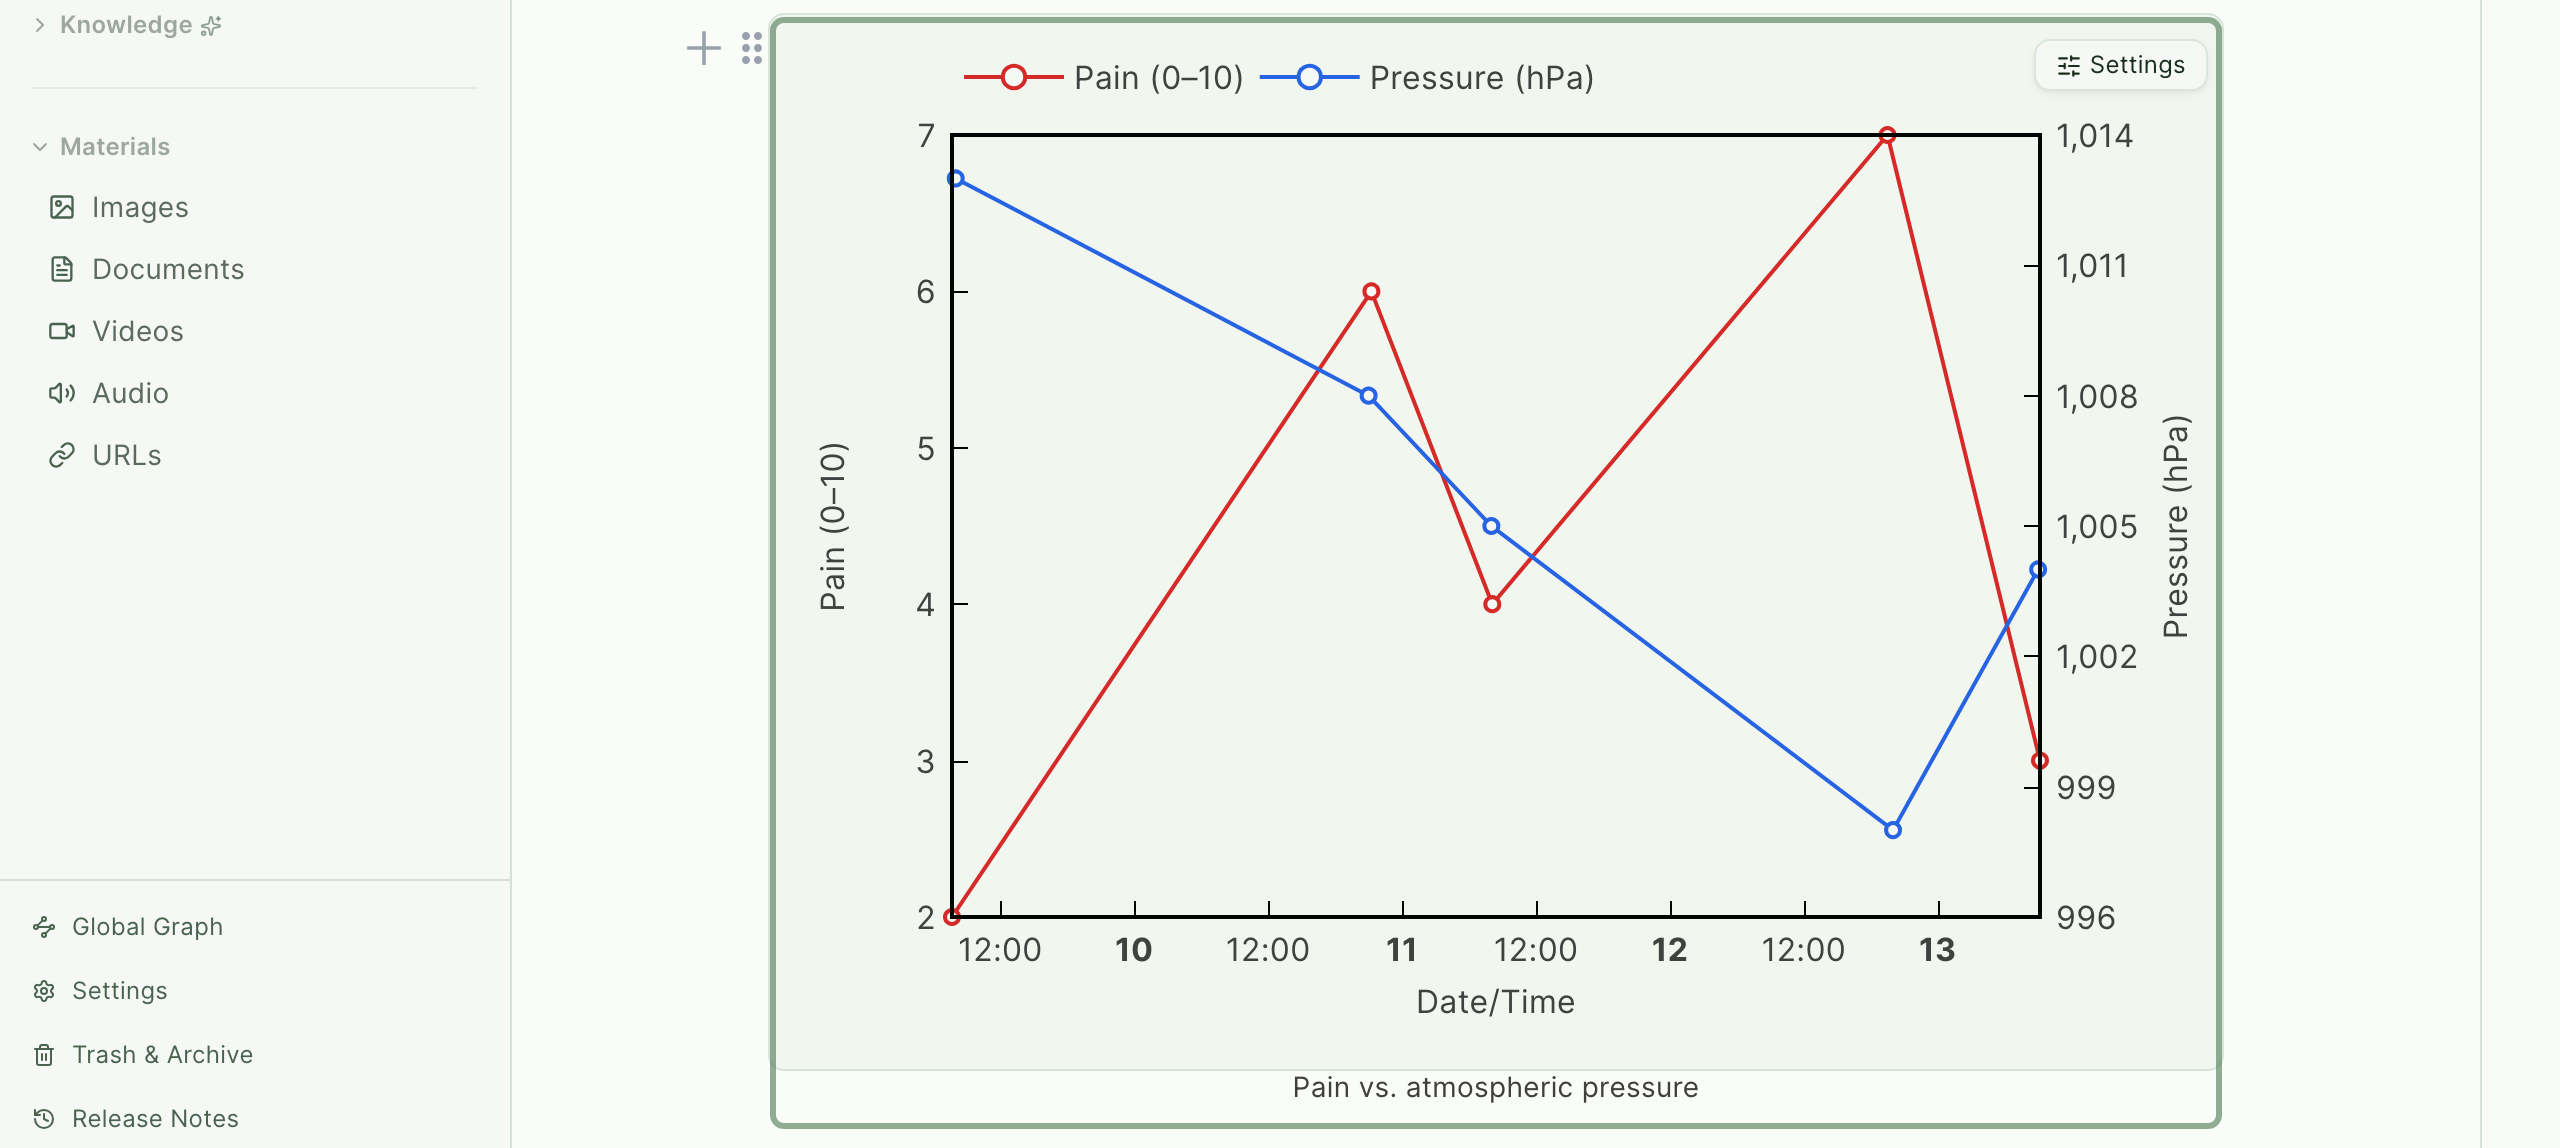
Insert it, pick a table, and open Settings in the top-right corner. The panel has three tabs:
- Type & Series — the chart type (Line, Bar, Scatter, or Histogram — the distribution of a numeric column) and the series. A series is the unit that knows its data: expand one to set its display label, its data assignment (its Source — a table in the note, picked by caption, e.g. Table 1, or a data asset — and the X/Y columns), its own chart type (mix a bar series into a line chart), which Y axis it belongs to, and its Style. Series can point at different tables, so two logs can be overlaid on one figure, and assigning a series to the right axis gives it its own scale: pain 0–10 on the left, pressure around 1000 hPa on the right.
- Pick a data asset… Added in v0.38.0 (2026-08-17) — a series can also draw from a data asset: a
.csv/.txt/.datfile already in your assets, or one you pick from disk, without pasting its table into the note. Open the series' Source field: after the note's tables it lists the assets the chart already reads (Asset: name) and, last, Pick a data asset…. Choose it, pick the file, confirm how it is read on the import screen (Use in chart), and the series draws from the file. An empty chart block offers the same Pick a data asset… beside the table names. This is how a past measurement or a reference pattern is overlaid on a figure in another note: today's XRD scan stays a table in today's note, last week's sample and the literature pattern come straight from the asset library. The file itself stays the source of truth — the block remembers only which asset and how it was read — and if the asset is later removed, the series shows (asset not found). - Style Added in v0.36.0 (2026-08-14) — besides the color: line type (solid, dashed, dotted), line width, marker visibility, shape (circle, square, triangle, diamond, each also hollow) and size, and bar width. For a figure that will be printed in black and white, this is how series stay distinguishable without relying on color.
- Stack Added in v0.36.0 (2026-08-14) — right under the chart type. This is the figure spectra are compared in: a measurement and its reference patterns offset vertically inside one frame, as XRD work is usually shown. Turning it on removes the Y-axis ticks — a row's height is a position for comparison, not an absolute intensity. Choose how heights are normalized (max to 1, or raw values), the gap between rows, the order (first at the bottom or the top), and where row labels go (in the figure or in the legend). Named in the figure, the corner each name sits in is set under Appearance Added in v0.37.2 (2026-08-16). Individual series can be nudged with scale and row position. Placing separate chart blocks side by side cannot produce this figure — each one repeats its own padding and axes.
- Pick a data asset… Added in v0.38.0 (2026-08-17) — a series can also draw from a data asset: a
- Axes — the X-axis scale type (Auto / Time / Numeric / Category — auto-detection can be overridden), axis labels, and min/max ranges for the X axis and for the left — and, when in use, the right — Y axis. Each axis also has an Advanced section: visibility toggles for the axis, axis line, ticks and tick labels, tick-label rotation, tick direction (inward, the academic default, or outward), and grid lines. The scale you pick applies to bar charts too Added in v0.37.2 (2026-08-16): choose Numeric or Time and the bars sit on that axis and take a min/max, which is how you narrow a bar chart to a range. On Auto, bars follow the same detection as the other chart types — a numeric X column puts them on a numeric axis, so a range can be set without changing anything. Text labels stay categorical, and so do dates on a bar chart, where one bar is one record. Pick Category to line numeric labels up at even spacing instead. Value axes fit the data range, while the Y axis starts at zero for bars and histograms, where the length is the quantity. A range cannot be set on a category axis, and the panel says so under the field.
- Appearance — a figure caption shown under the chart, the aspect ratio (√2:1 standard, golden φ:1, 2:1, 3:1, and spectrum-friendly 4:1 / 5:1 for wide patterns like XRD, plus 1:1), the legend (above the plot aligned to its frame, inside any of the four corners, or below; horizontal or vertical), and the plot frame. While stacked rows are named in the figure there is no legend to place, so this is where Name position appears instead Added in v0.37.2 (2026-08-16): the names go in one of the four corners of their own row — inside it, so a name belongs to the row it names rather than to the gap above or below.
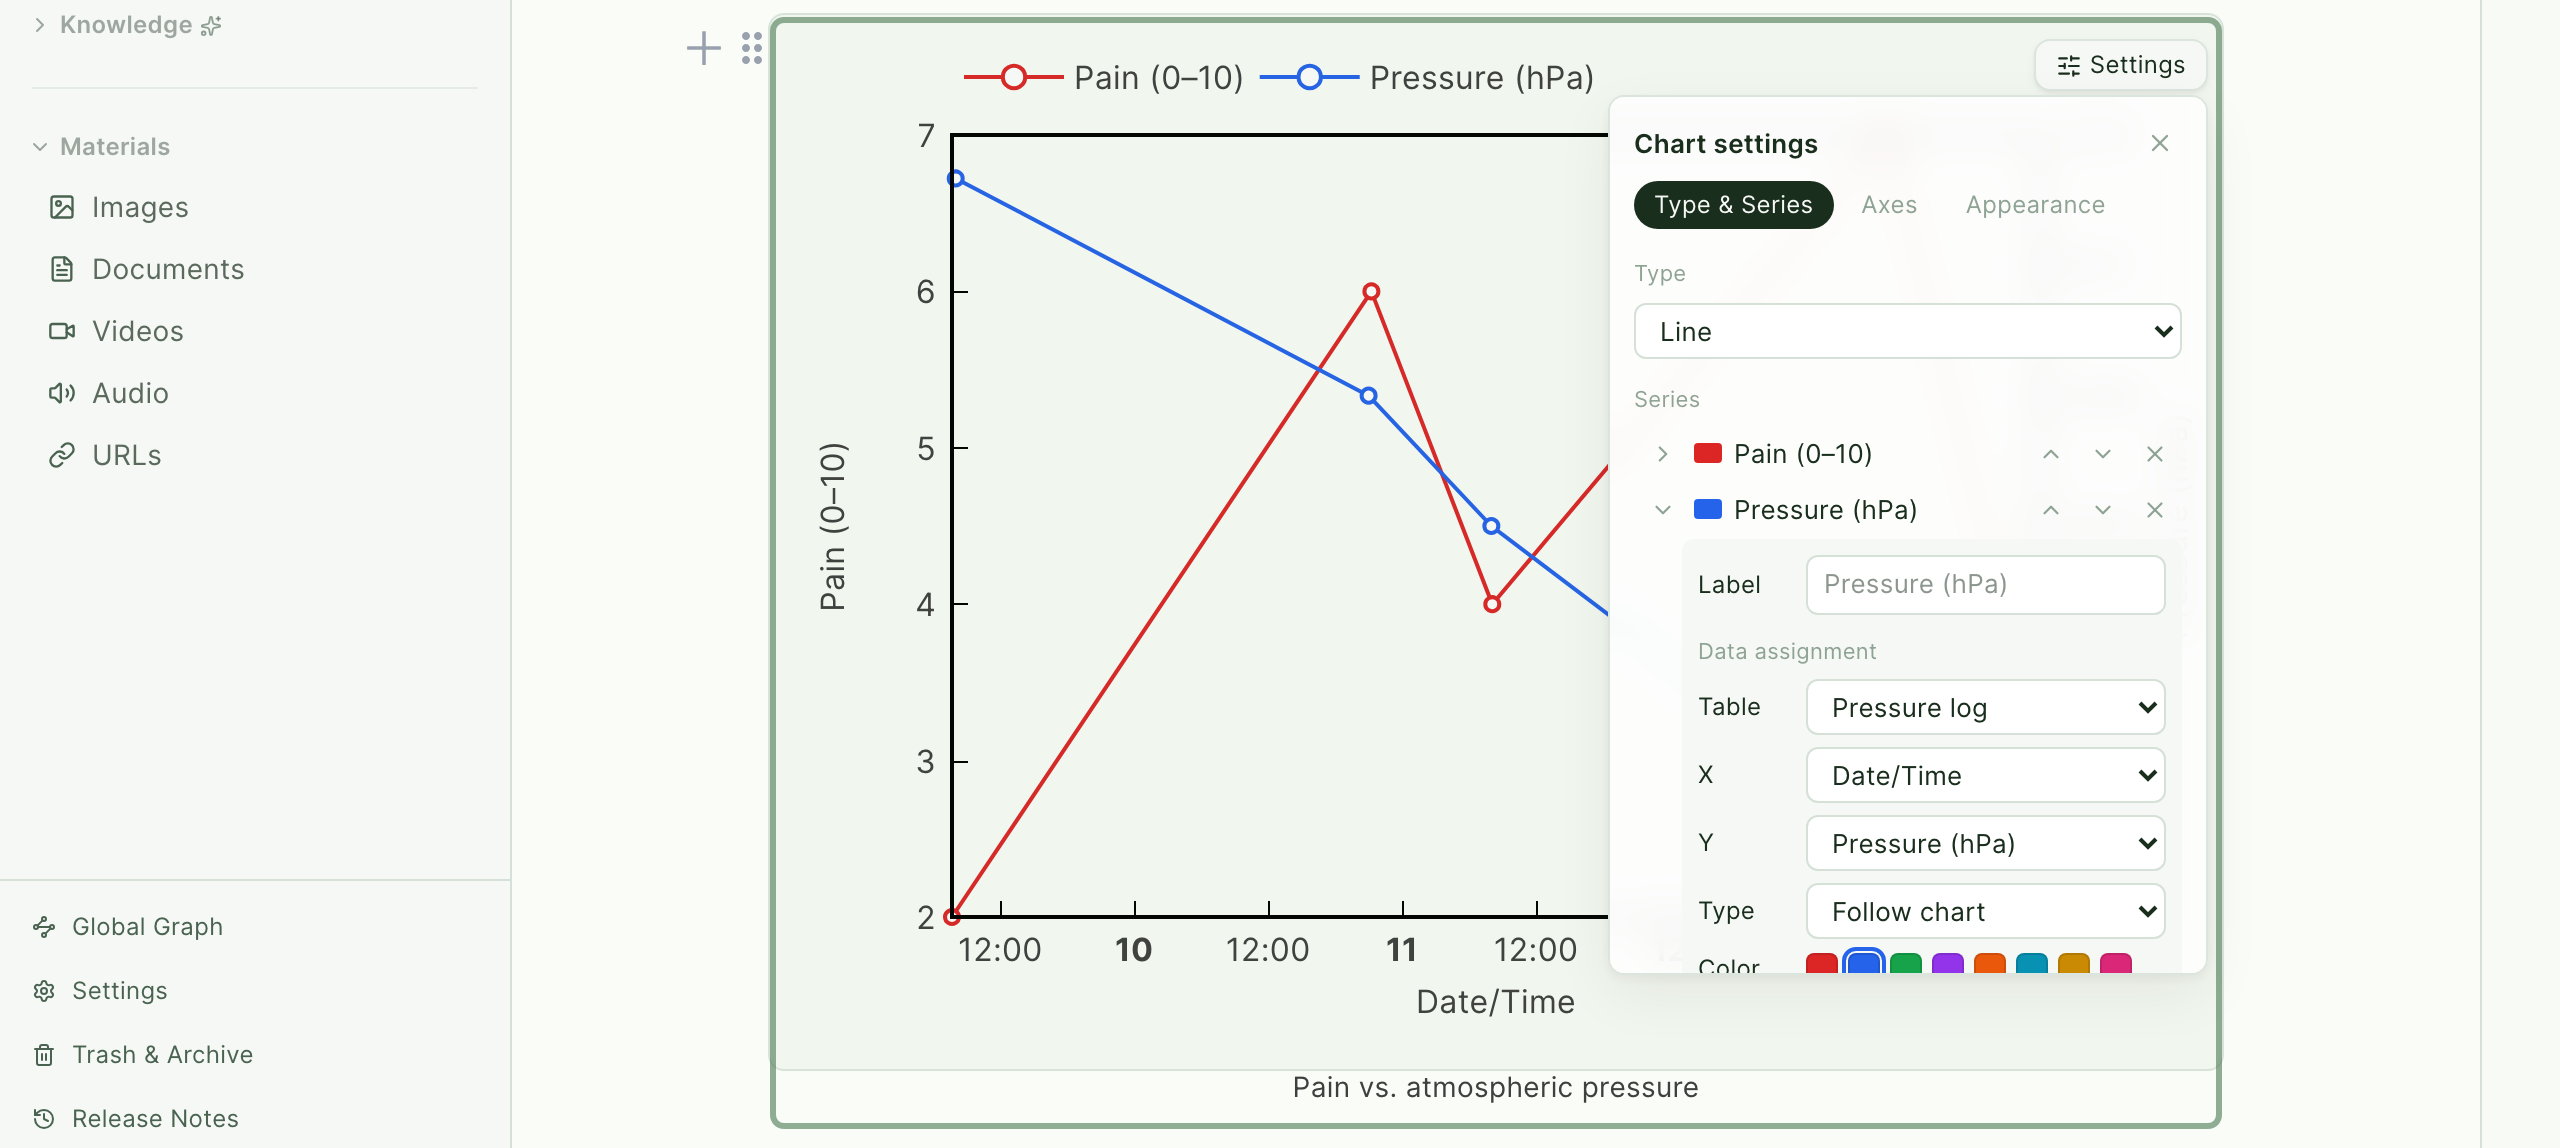
The table stays the source of truth: edit a cell or add a record and the chart follows. If the referenced table is deleted, the block shows "The referenced table was not found in this note" and lets you pick another one. If a series draws from a data asset that no longer exists, the block says "The referenced data asset was not found" instead.
Importing measurement data Added in v0.36.0 (2026-08-14)
The .csv, .txt, and .dat files instruments write can become tables in a note, preamble and trailing notes and all.
Pick Data from the / menu — the picker offers both the files already in your assets and a new one from disk. Dropping a file straight onto the editor opens the same screen.
The header row, the range to read, and the delimiter are already guessed when it opens. The original file is on the left, the resulting table on the right, so the usual interaction is to glance at both and press Import. The settings above are there for when the guess is wrong.
- Row range — the header row and the last data row. The preamble and the trailing notes fall outside it
- Delimiter — comma, tab, space, or any single character. For output padded with runs of spaces to line the columns up, use Treat consecutive delimiters as one
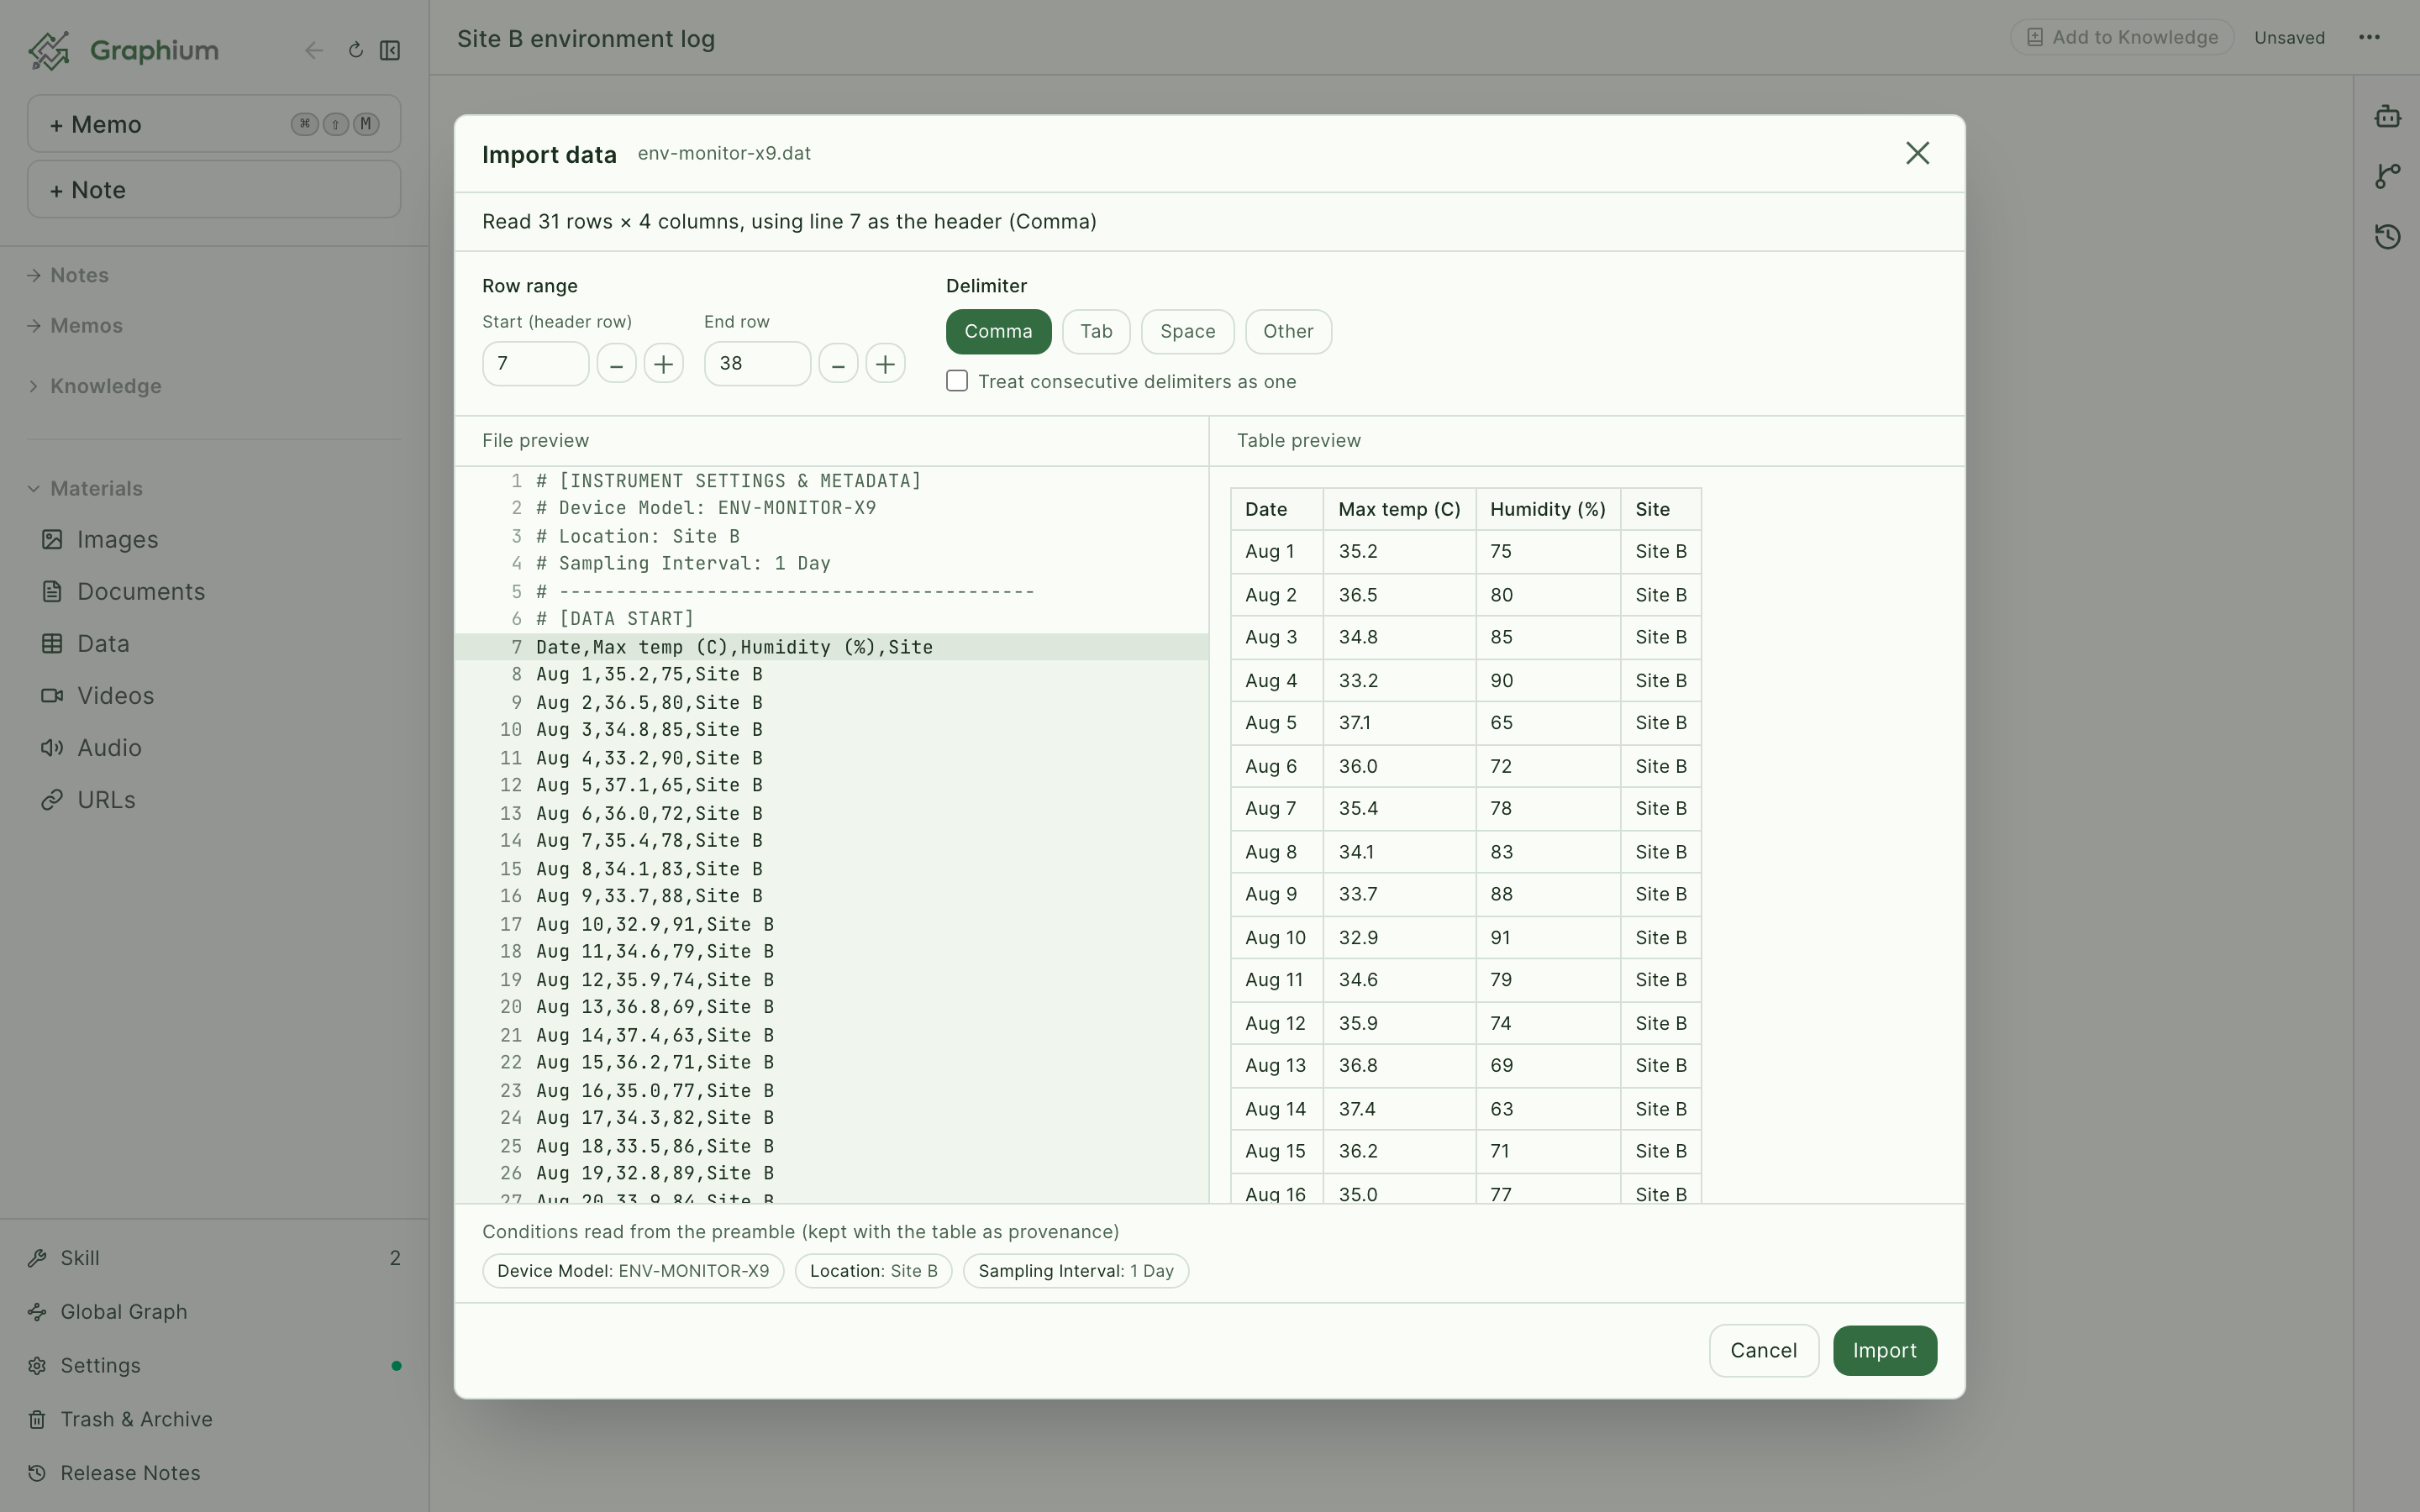
Lines like Device Model: ENV-MONITOR-X9 from the preamble are kept alongside the table as the conditions the data was measured under. A converter usually discards them first; in a lab note they are part of the record.
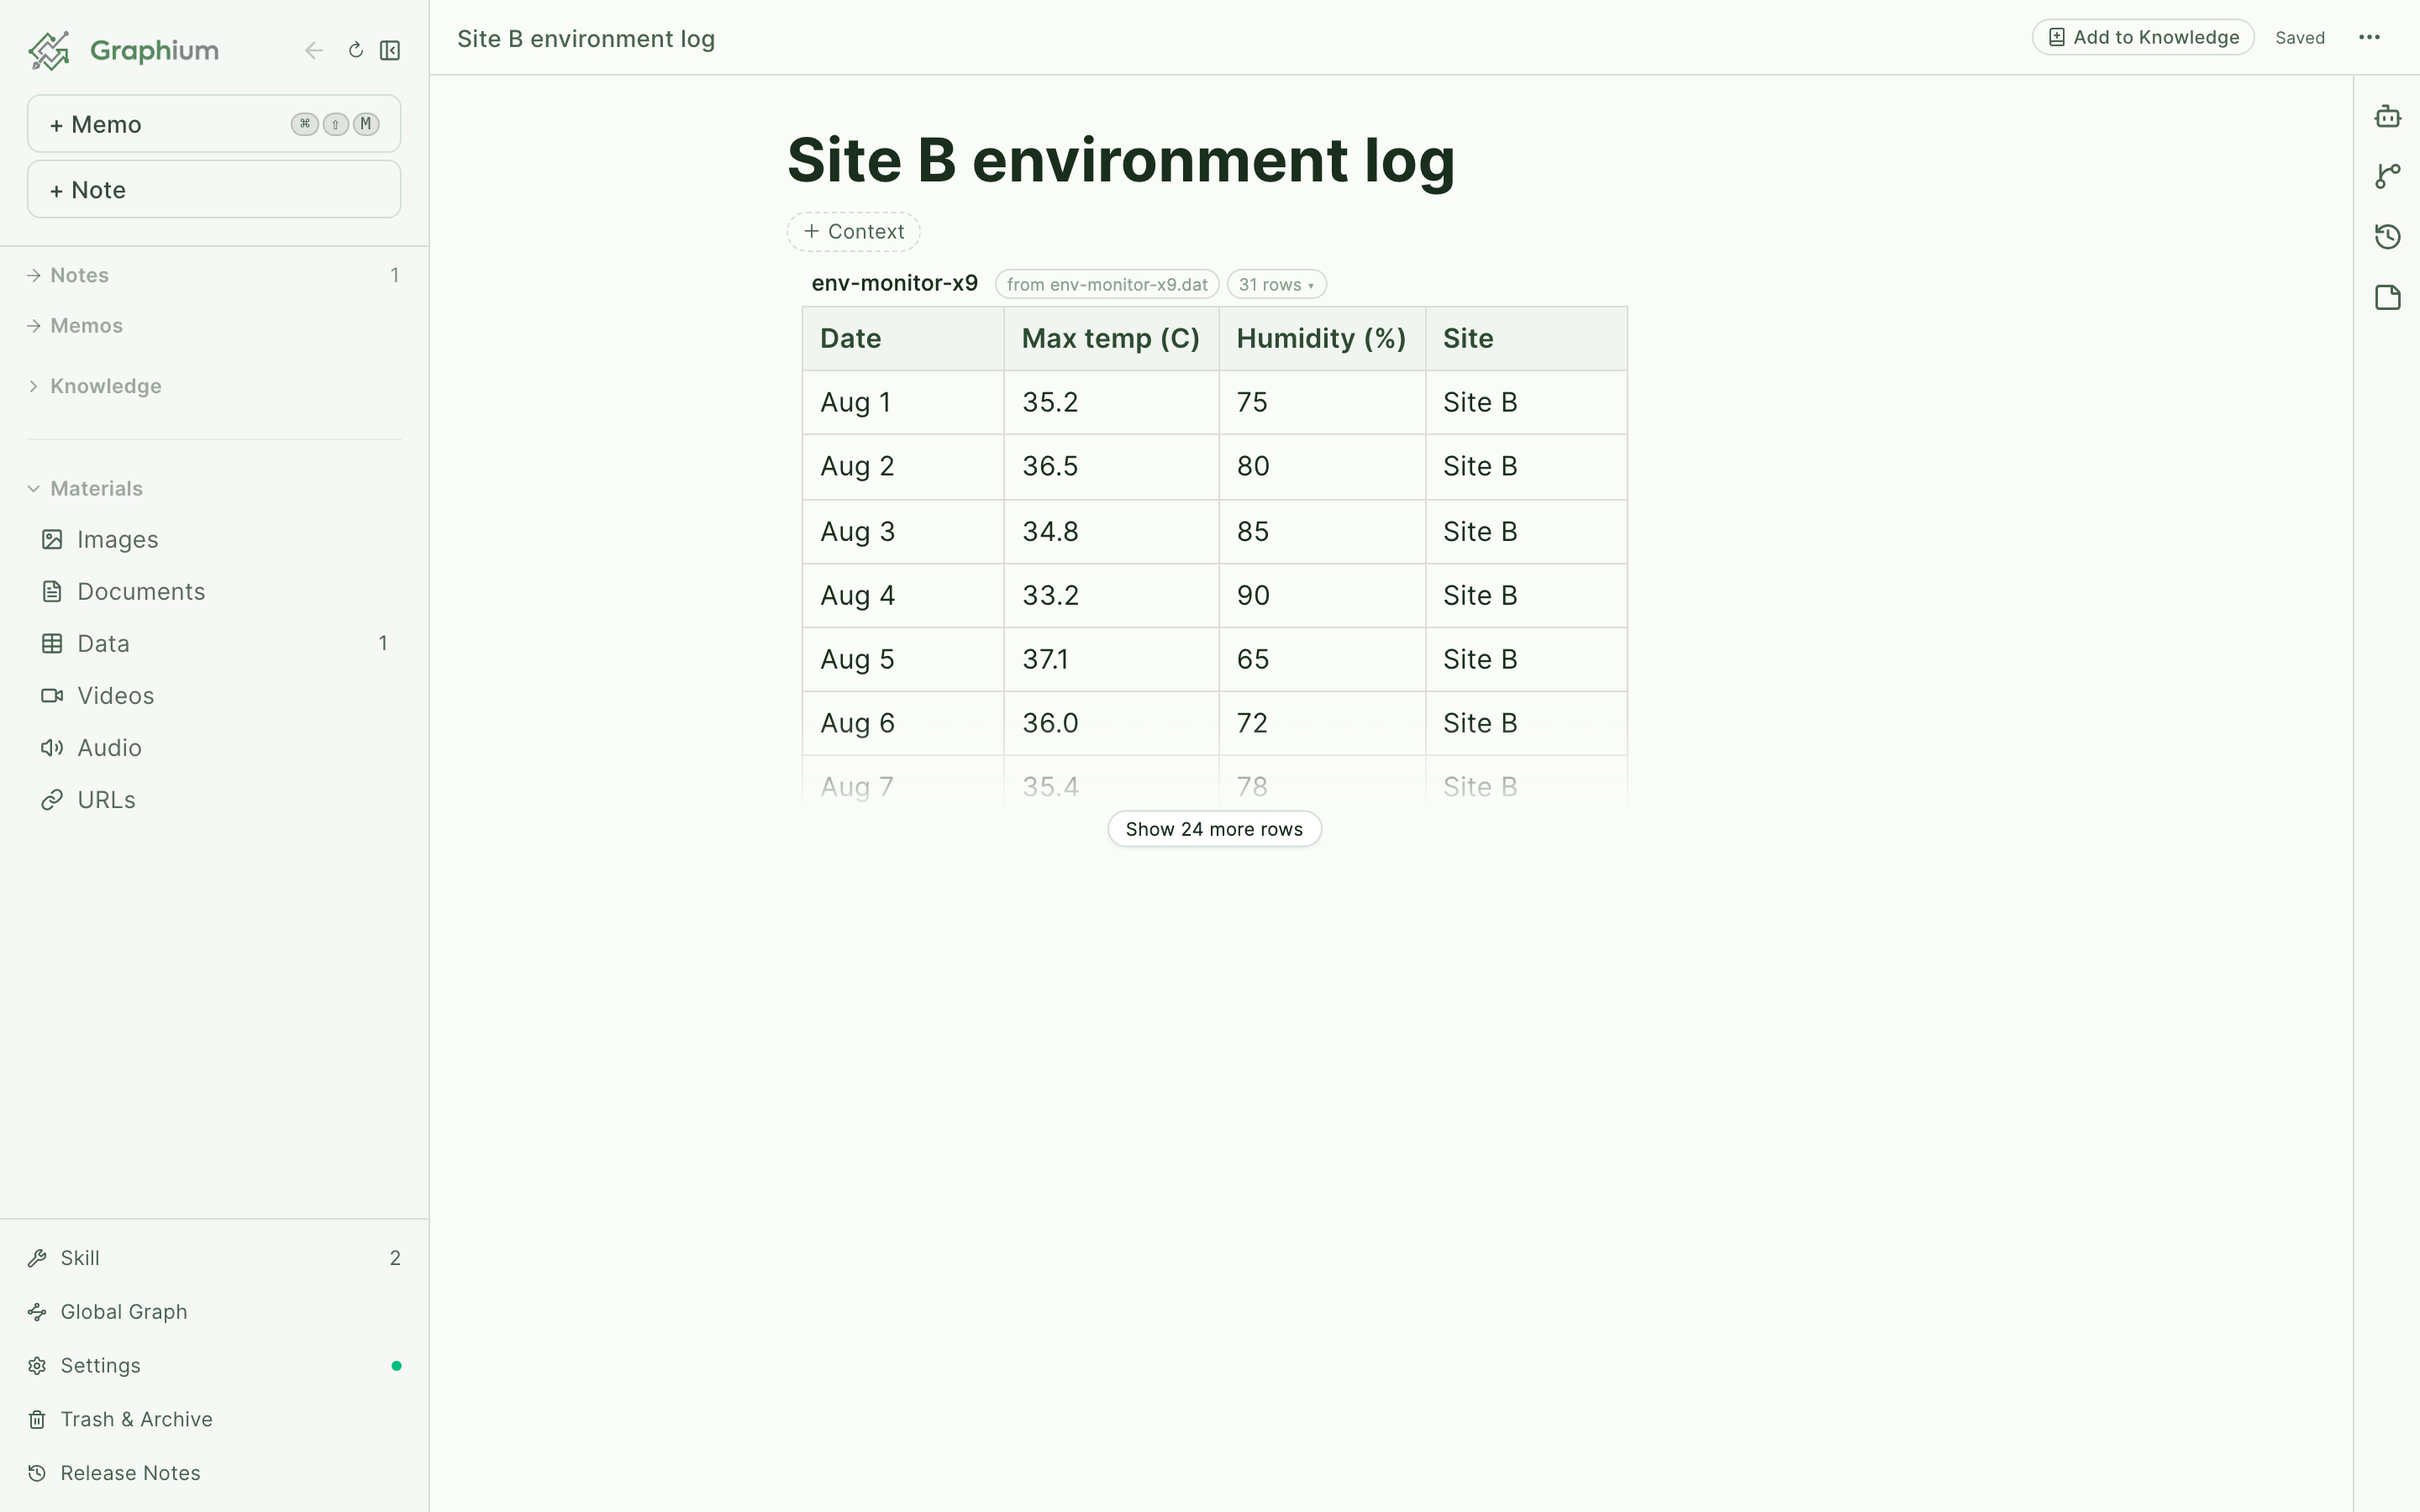
An imported table carries its source next to its name. Press it to reopen the same screen and rebuild the table with a corrected range or delimiter — the table keeps its place and its name. The file itself stays as a Data asset, so the numbers lead back to the raw output. Importing the same file twice does not add a second asset.
A long table is cut off with a "show N more rows" button at its foot, so a note does not fill up with data; press it to see all of it. Very long files (more than 2000 data rows) open with the range limited to the beginning — raise the end row to bring in the rest.
A file does not have to become a table to be plotted — a chart can read a data asset directly (see charts above), which keeps a note free of tables that exist only to be drawn.
Linking notes with @
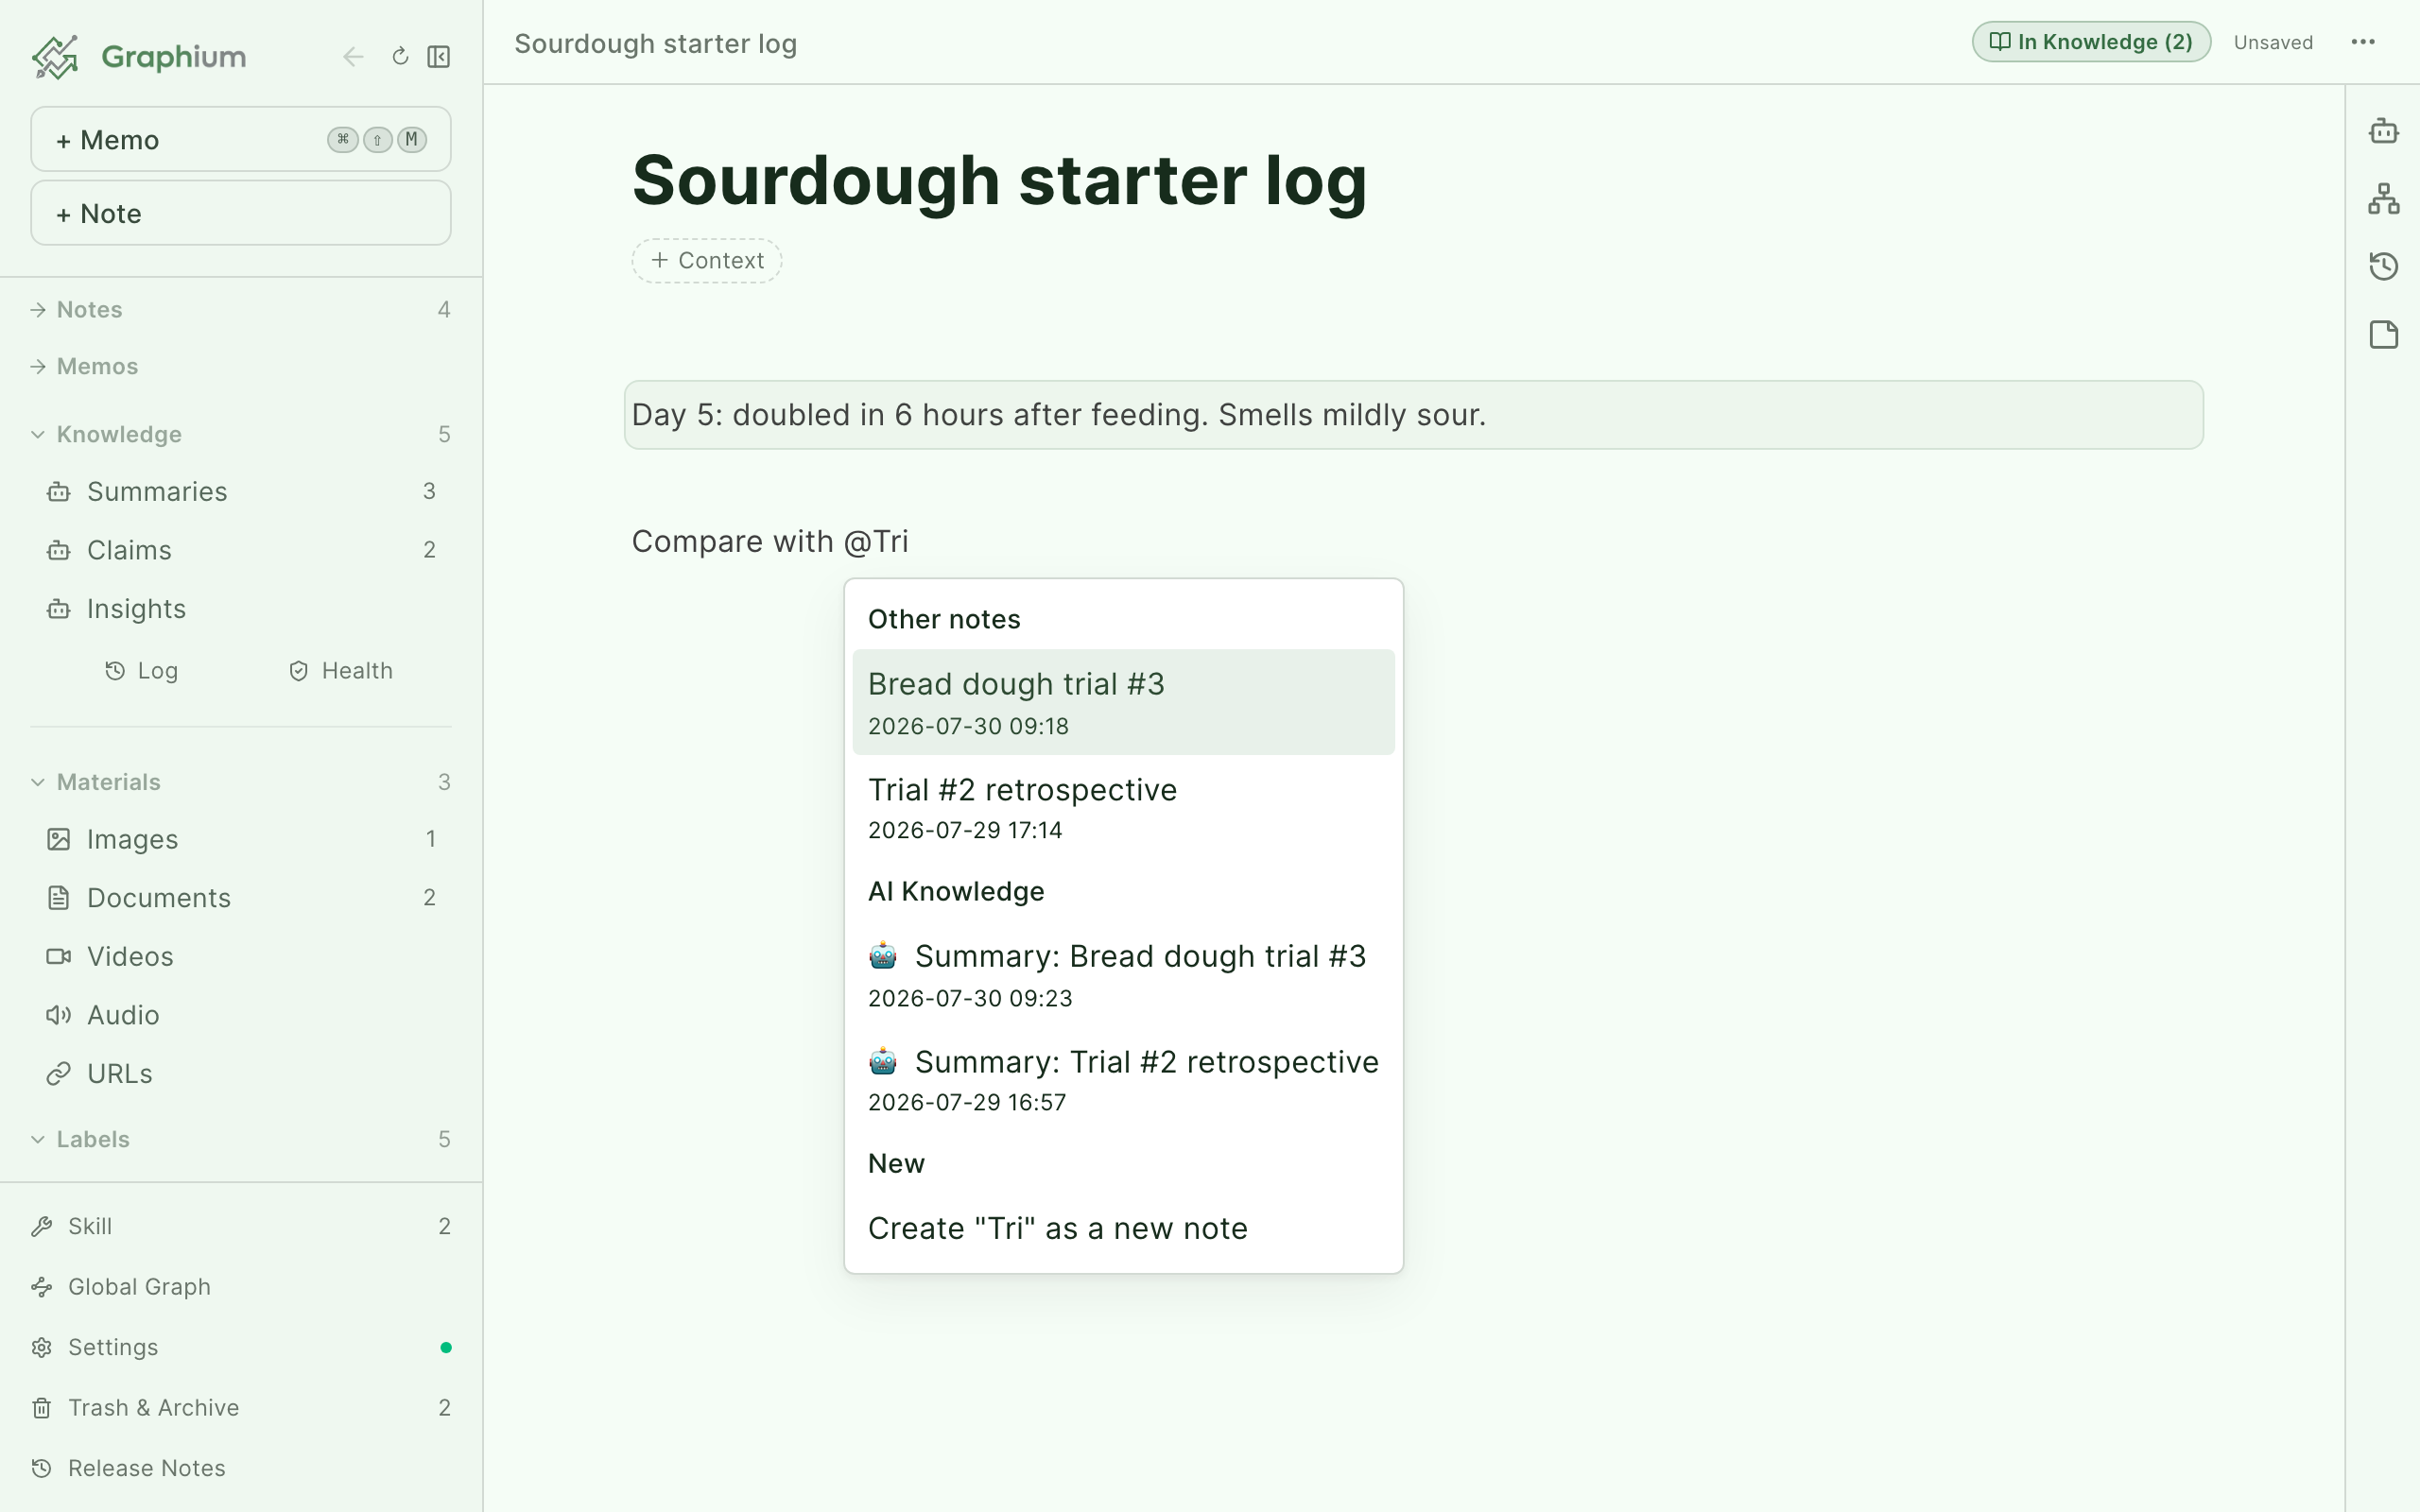
Type @ anywhere in the text to open the link menu. Candidates are grouped:
| Group | Contains |
|---|---|
| This note | Headings inside the current note. |
| Other notes | Your other notes, most recent first. |
| AI Knowledge | Knowledge-layer notes, labeled like "🤖 Summary: …". |
| Document materials | Imported PDF / Word materials, for citing sources. |
| New | Create a new note… — name it in a dialog, and it is created and linked in one step. |
Mentions are live references, not plain text: rename a note and every @mention of it updates in the notes that refer to it. Added in v0.16.10 (2026-07-03)
Selecting multiple blocks
Drag across several blocks to select them together. A floating toolbar appears with Delete, Color, and Ask AI about selection, so you can clean up or question a whole passage at once.
Finding text in a note Added in v0.15.2 (2026-06-08)
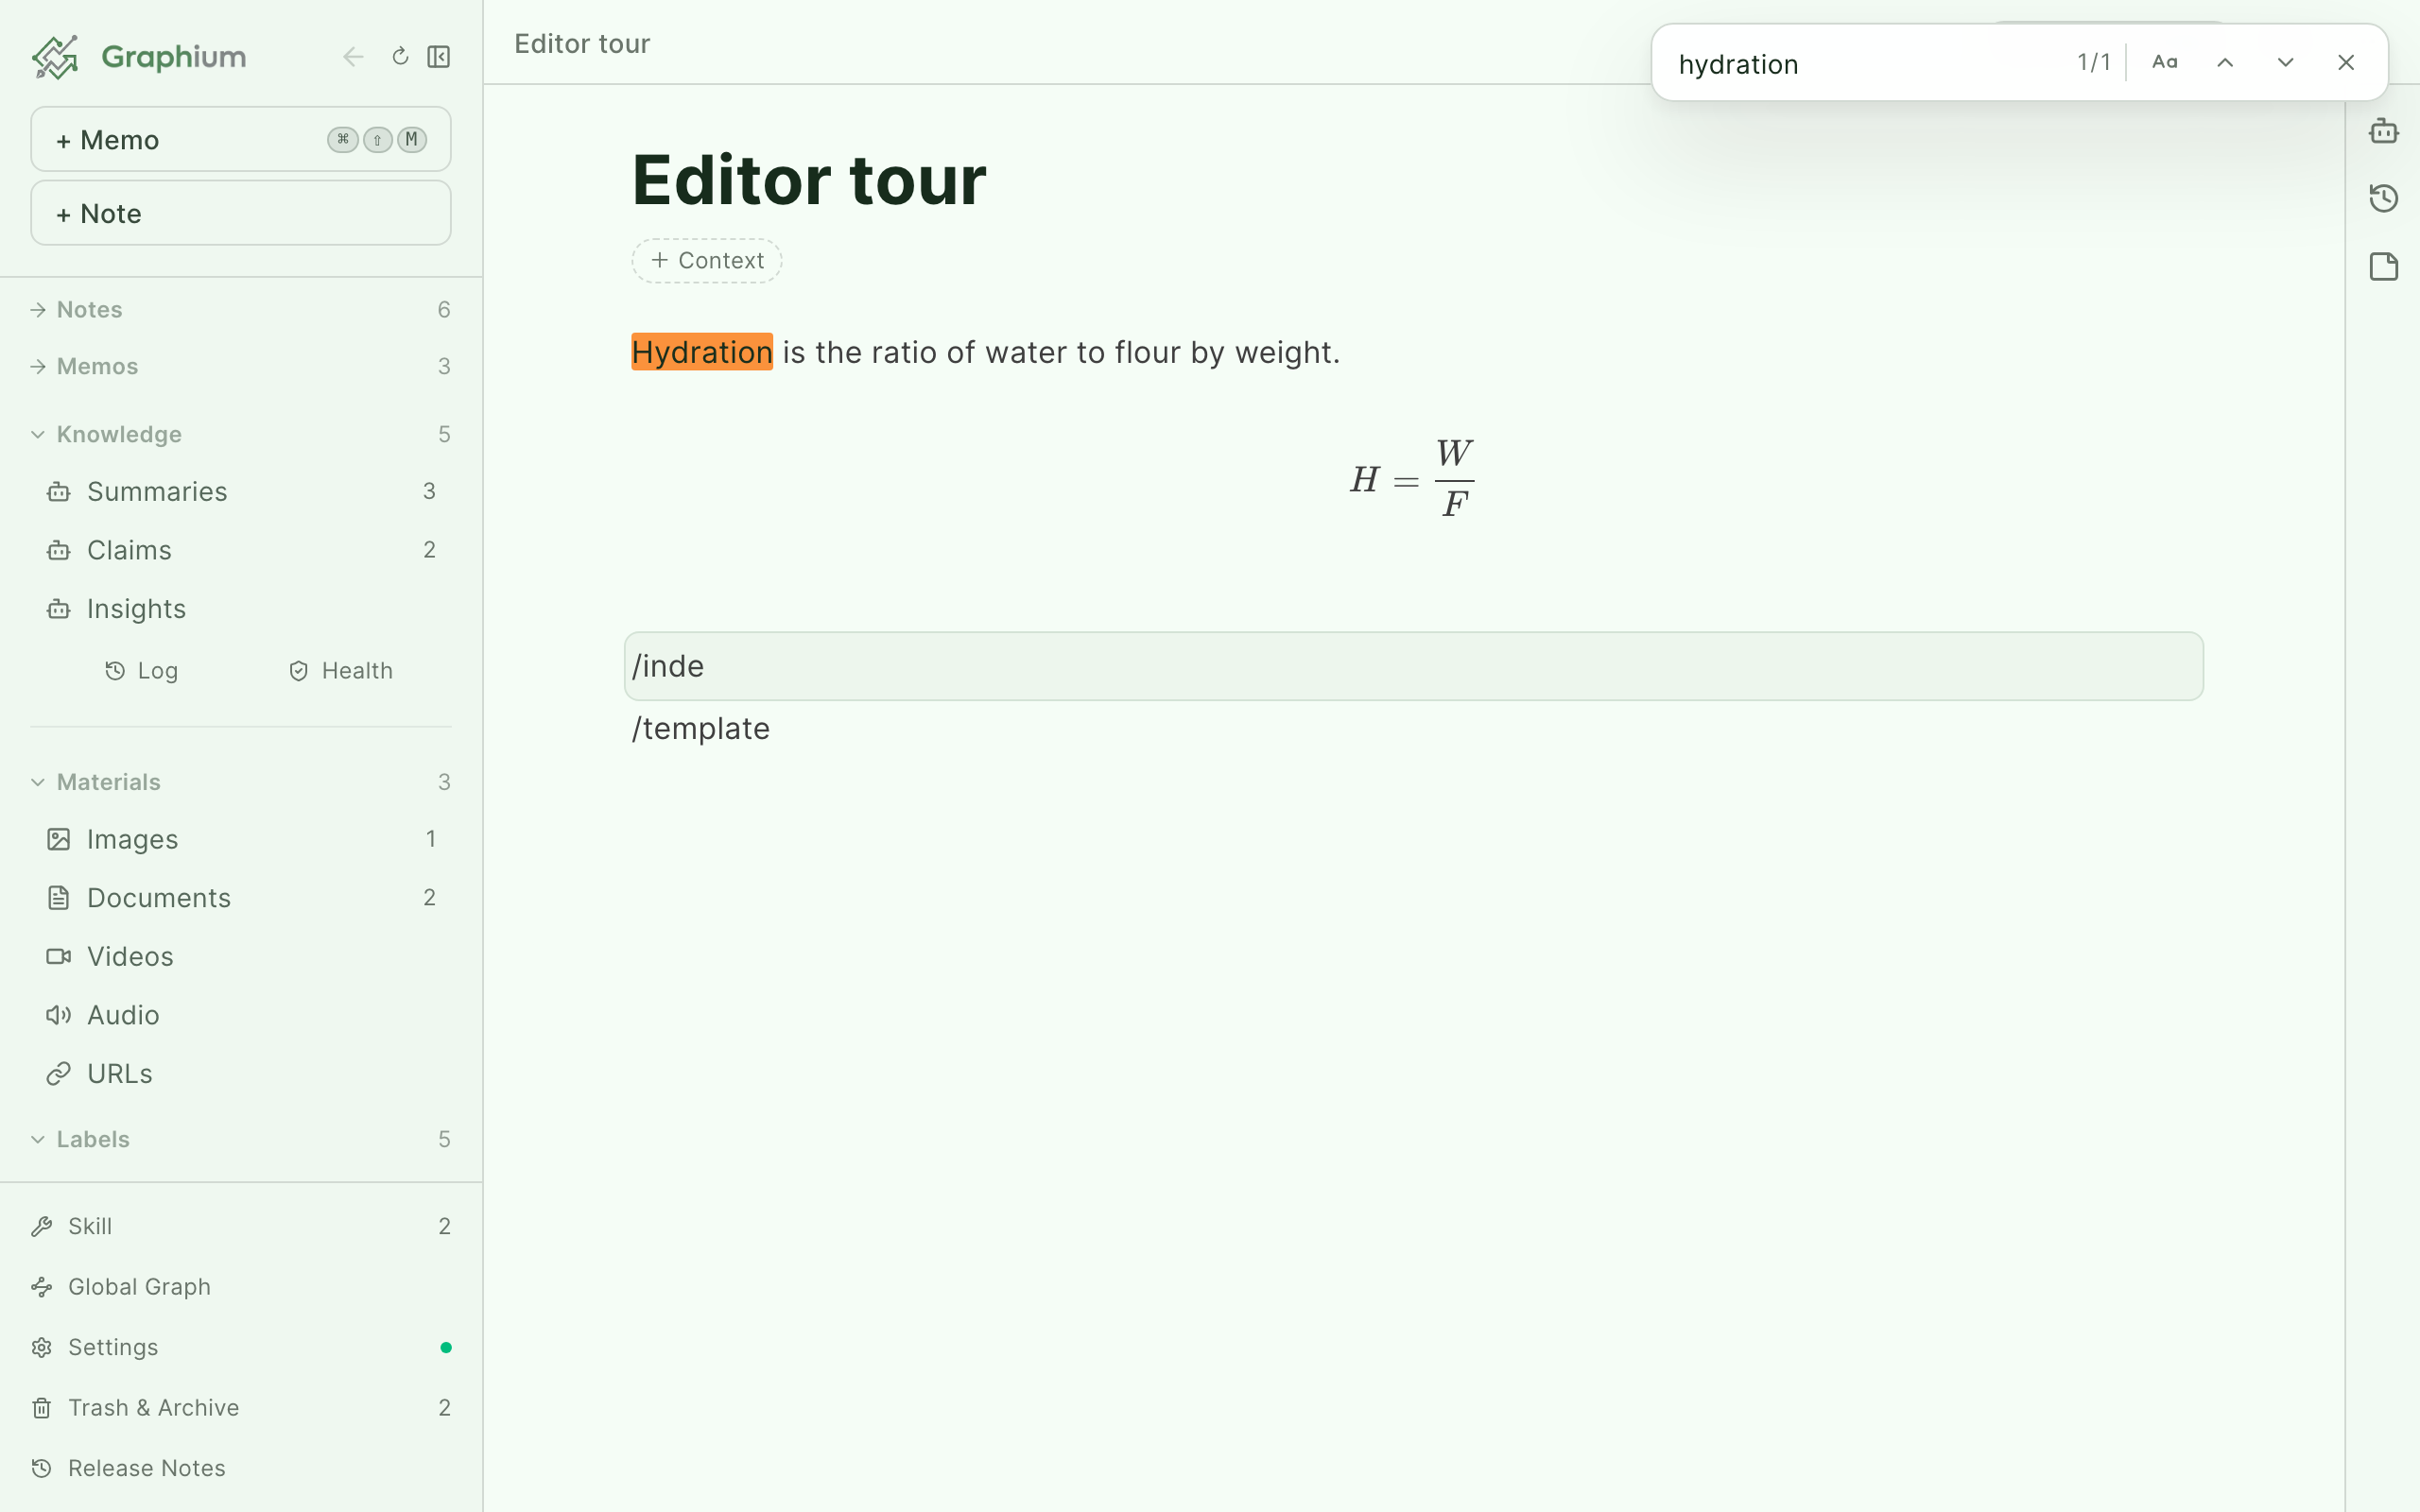
⌘F (Ctrl+F on Windows/Linux) opens the Find in note bar. Matches are highlighted with a counter ("2/7"); Enter jumps to the next match, Shift+Enter to the previous, Match case toggles case sensitivity, and Esc closes the bar.
Inserting saved memos
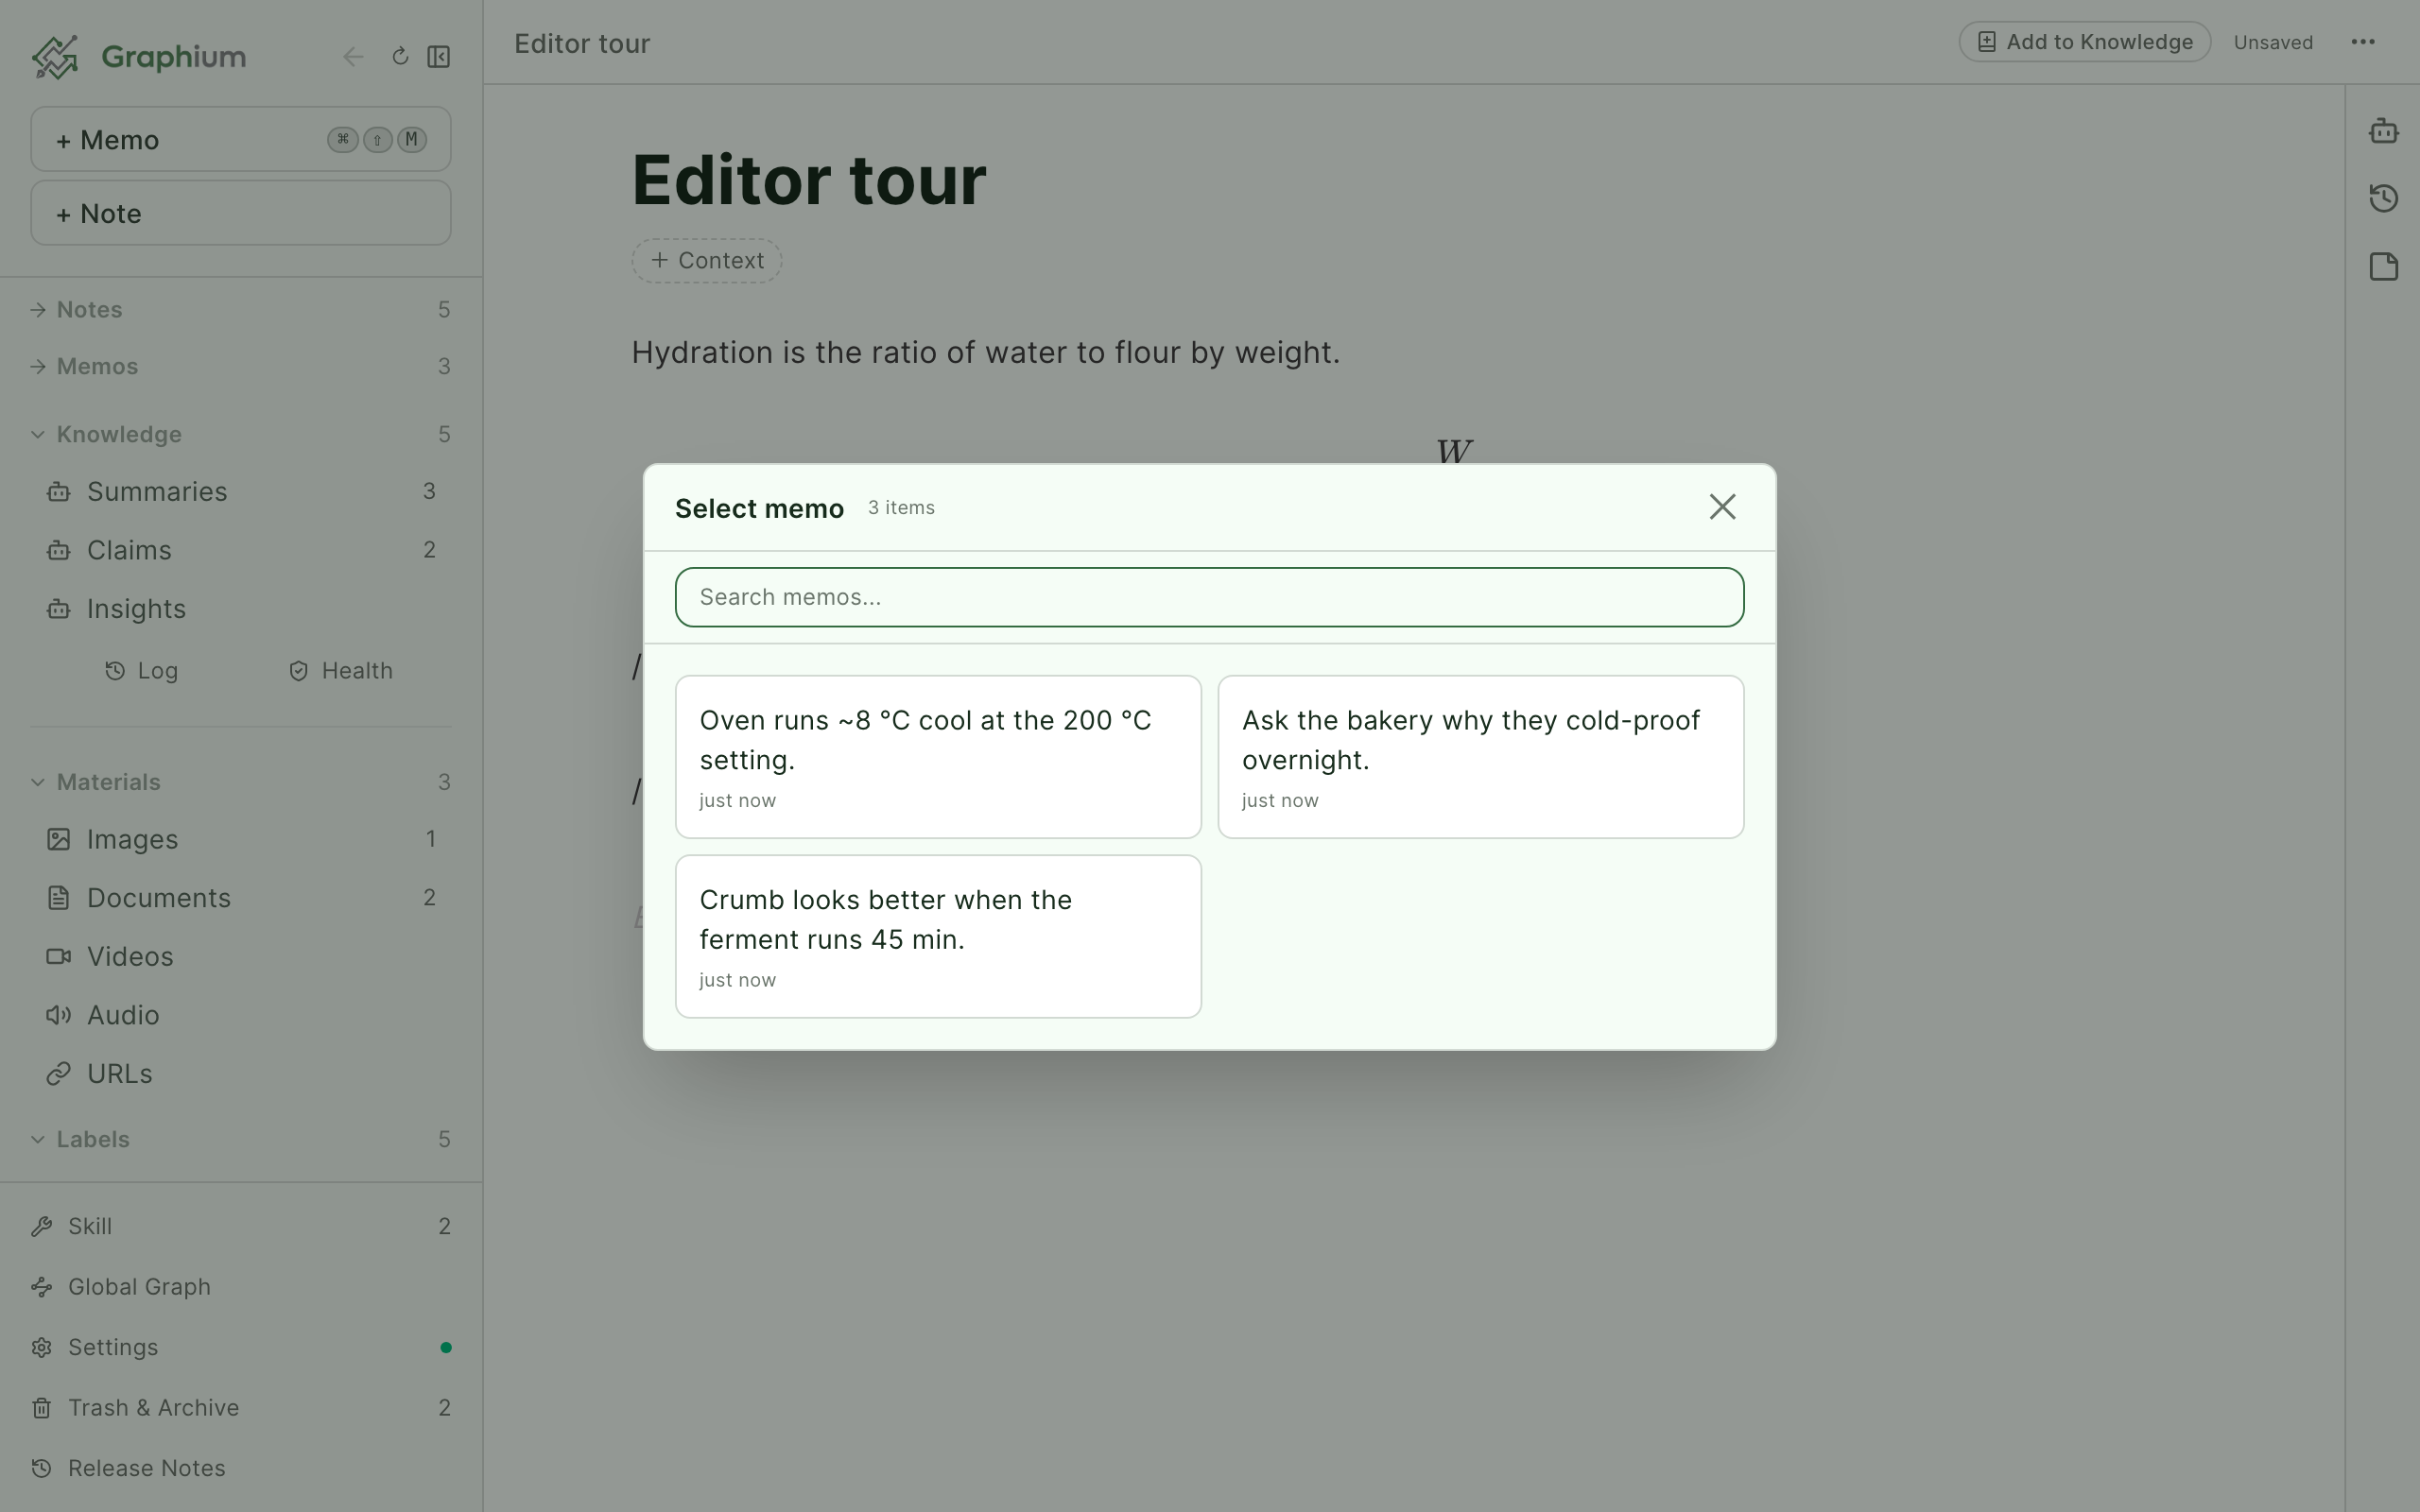
Memo in the slash menu opens the Select memo picker with everything you have captured — quick memos (⌘⇧M, Ctrl+Shift+M on Windows/Linux) and notes-to-self from your phone. Pick one to drop its text into the note. See Mobile for capturing on the go.
Saving
Graphium autosaves three seconds after you stop editing; the header shows Unsaved, Saving..., and Saved so you always know where you stand. ⌘S (Ctrl+S on Windows/Linux) saves immediately.
History and versions
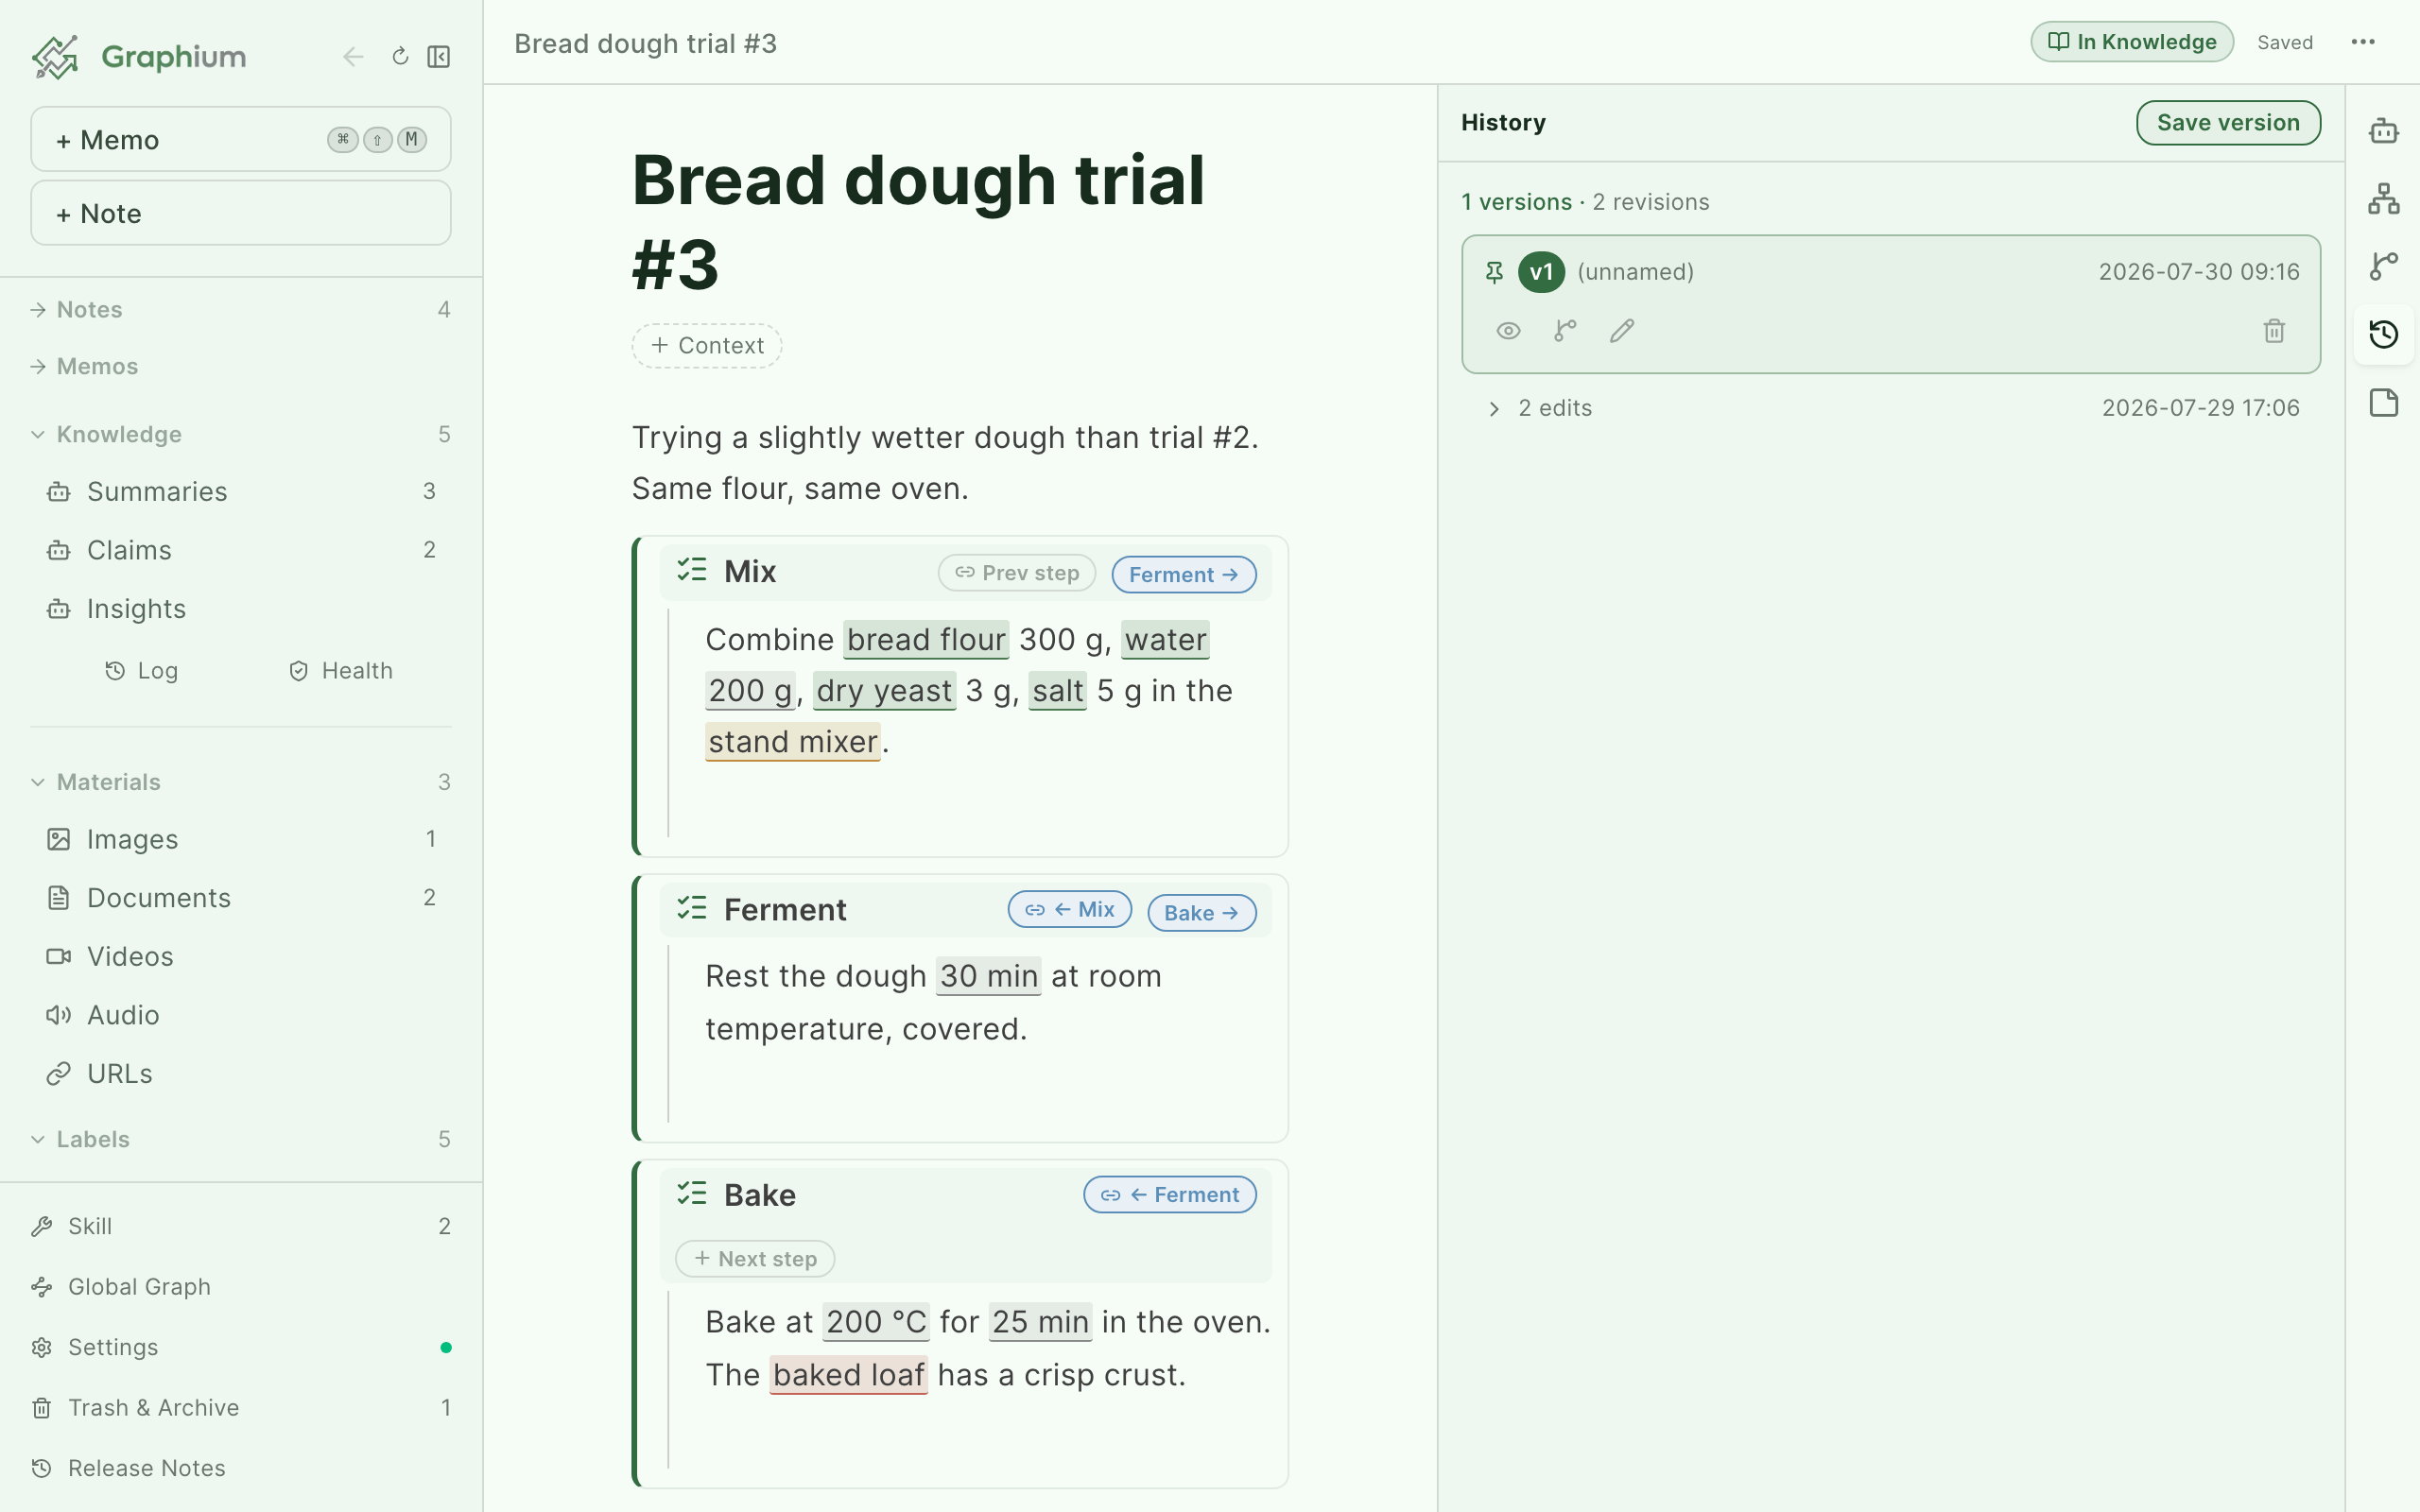
Every save is kept. The History tab in the right panel lists what changed (blocks, labels) and who changed it: human edits carry the name and email from your author profile (Settings → Storage), AI edits carry an AI badge and the model that made them, with entry types like Edit, Derive, AI Generate, and Template.
Version snapshots Added in v0.18.0 (2026-07-15)
Automatic history is fine-grained; sometimes you want to pin a moment on purpose — "the state we submitted." Press ⌘⇧S (Ctrl+Shift+S on Windows/Linux; ⌘⌥S works too, for keyboards where ⌘⇧S is taken) or click Save version at the top of the History tab.
Saved versions are listed in the same panel. Each one offers:
| Action | What it does |
|---|---|
| Open | View the version side-by-side, marked Read-only |
| Fork from here | Create a new note from this version, with lineage back to the original |
| Rename | Give the version a meaningful name |
| Delete | Remove the version (the note itself is untouched) |
Forking is how you explore a different direction without losing the original: the new note records where it came from, and that link shows up in the lineage graph.
Context tags
Under the title of every note sits a Context button. Context tags are free-form categories or themes ("battery project", "reading notes") — type to add one, or pick from tags you have used before. They are the fastest way to slice the notes list (Filter by context) and to color the global graph by project.
Empty-note hints
A brand-new note shows a quiet row of hints below the editor: "Start writing, or try one of these:" — Ask AI ("Ask AI about your note, or insert its answer"), Link a note ("Type @ inline to reference another note"), and Slash menu ("Type / in an empty line for blocks and tools"). The Ask AI chip only appears once AI is set up. The hints disappear as soon as the note has content.